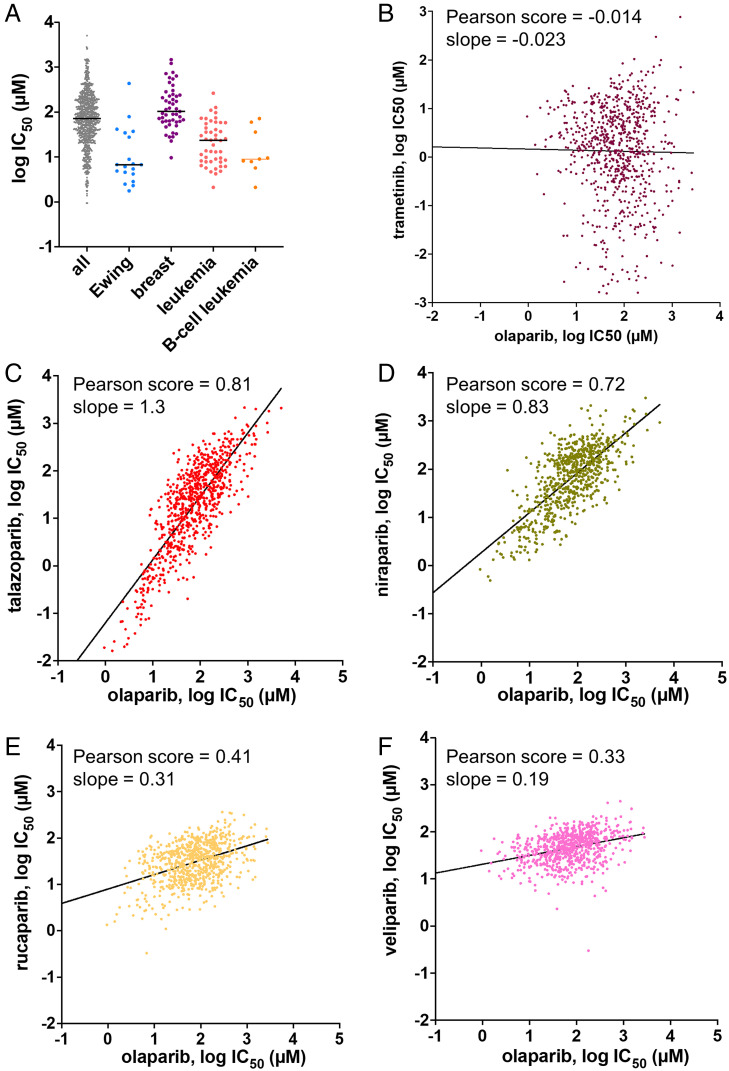
Fig. 4.
(A) Distribution of potencies for triggering cell death in 1,000 different cell lines by olaparib. The leftmost column includes all 1,000 cell lines studied in the Genomics of Drug Sensitivity in Cancer. Subsequent columns to the right display cancer-specific cell types wherein the breast cancer cell lines are not predominantly BRCA−/−. The line indicates the median value. The data were obtained from https://www.cancerrxgene.org. (B–F) Comparison of the potency of olaparib to other PARPi in a panel of 1,000 different cell types. The data were obtained from https://www.cancerrxgene.org. The IC50 values for each inhibitor were downloaded in an array and compared to the IC50 values for the other inhibitors for each cell line for which the database contained a value. Each data point represents the log IC50 value of a PARPi (B, trametinib; C, talazoparib; D, niraparib; E, rucaparib; F, veliparib) vs. the log IC50 value of olaparib for a different cell line. To facilitate interpretation and comparisons between the different graphs, the axes are “square” (one log unit is the same length on both x and y axes), and the scales are the same for all five graphs. The black line represents a best-fit linear correlation between the two inhibitors and the Pearson correlation coefficient and slope value are indicated for each graph.

