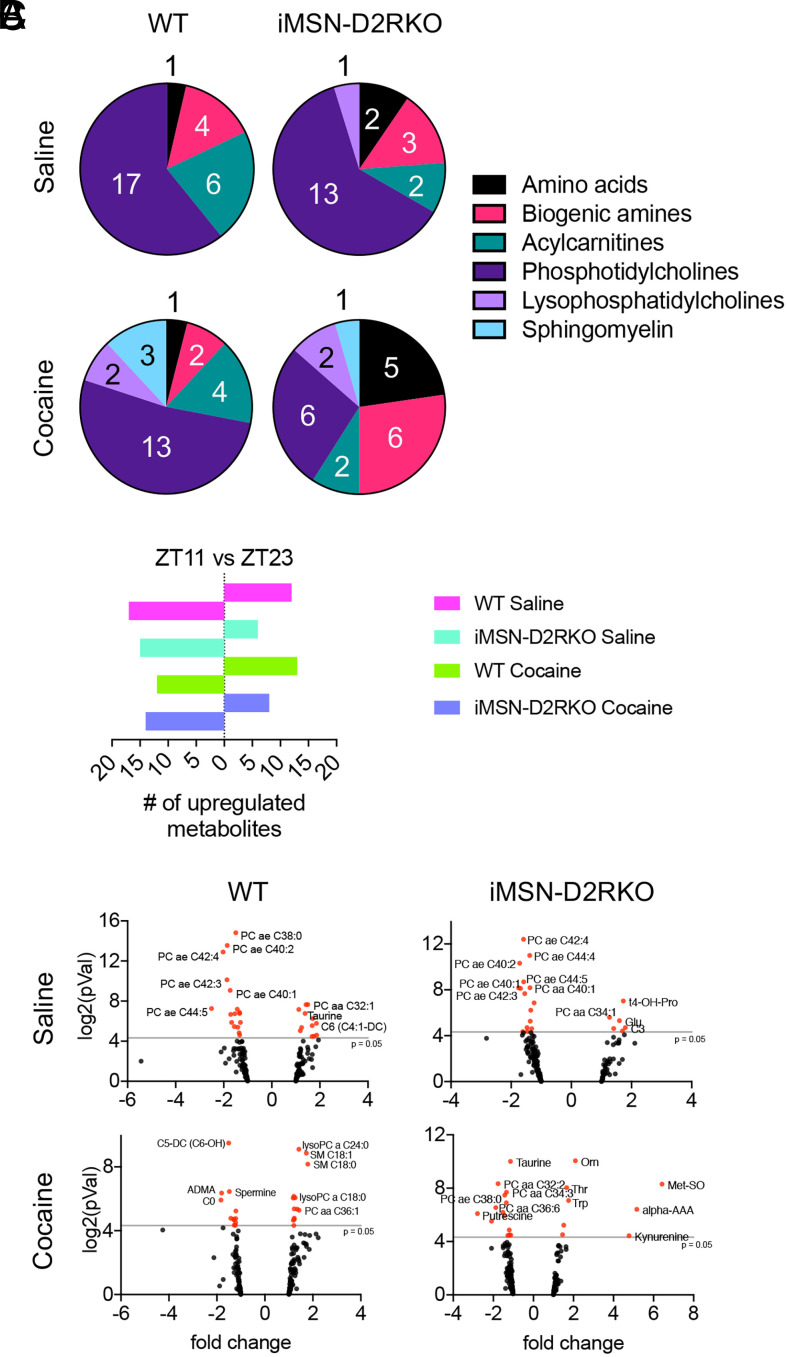
Fig. 4.
Differential effects of cocaine on the liver metabolome. (A) Pie charts representing the percentage of liver metabolites of each class displaying different levels at ZT11 versus ZT23 in saline- or cocaine-treated WT or iMSN-D2RKO mice as indicated. (B) Number of metabolites up-regulated at either ZT11 or ZT23 in saline- or cocaine-treated mice as indicated. (C) Volcano plots of metabolites at ZT11 and ZT23 in livers from WT or iMSN-D2RKO mice treated with saline or cocaine. Metabolites with significant changes between time points were identified when the P value was <0.05 (red dots); n = 5, ANOVA Benjamini–Hochberg corrected, cutoff, P < 0.05; pVal, P value.

