Fig. 1.
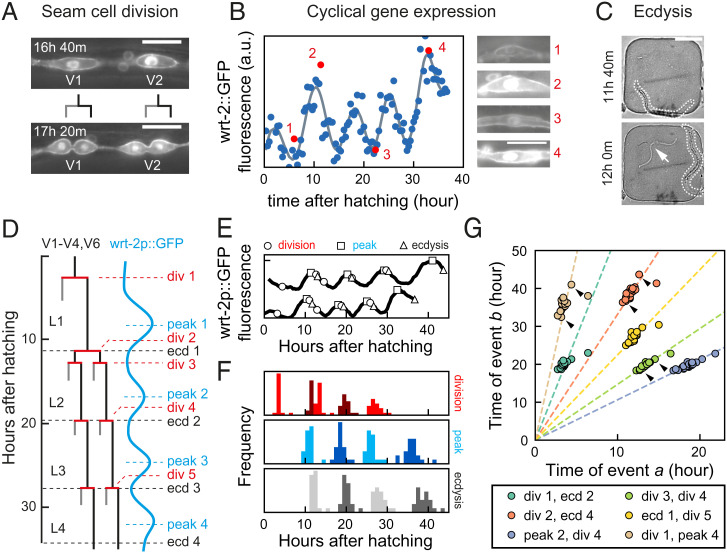
Scaling of developmental timing in individual animals. (A–C) Measuring timing of seam cell division, oscillatory gene expression, and ecdysis. (A) Seam cells divide once or twice every larval stage into hypodermal (gray line) or seam cell (black line) daughters. V1- to V6 seam cell division timing was determined using the wrt-2p::GFP::PH; wrt-2p::GFP::H2B fluorescent reporter (wrt-2p::GFP). (Scale bar: 15 µm.) (B) Oscillatory wrt-2 expression was visualized in seam cells of wrt-2p::GFP animals (images 1 to 4, showing posterior V3 seam cell). Time of each wrt-2 peak was determined from the fluorescence averaged over V1 to V6 seam cells (circles) by fitting (gray line, SI Appendix, section S4). Numbers indicate the time points in the side images. (Scale bar: 15 µm.) (C) Ecdysis time was determined by the emergence of the larva (outlined) from the cuticle (arrow). (Scale bar: 100 µm.) (D) Overview of seam cell divisions, wrt-2 peaks, and ecdysis events during larval development. The V5 lineage lacks division 2. (E) Example of variability in timing between two wild-type animals. Markers indicate the timing of divisions (circles), peaks (squares), and ecdyses (triangles). Tracks are running averages with 2-h window size of the data as shown in B, shifted along the vertical axis for clarity. (F) Distribution of events times for standard conditions, wild-type animals fed E. coli OP50 diet at 23 °C (n = 21). (G) Measured times of event pairs , for animals in F. Markers represent single animals. Arrows indicate the examples in E. Times of event pairs show temporal scaling; that is, they cluster along lines of constant , even as individual event times and vary between individuals. Dashed lines are fits .

