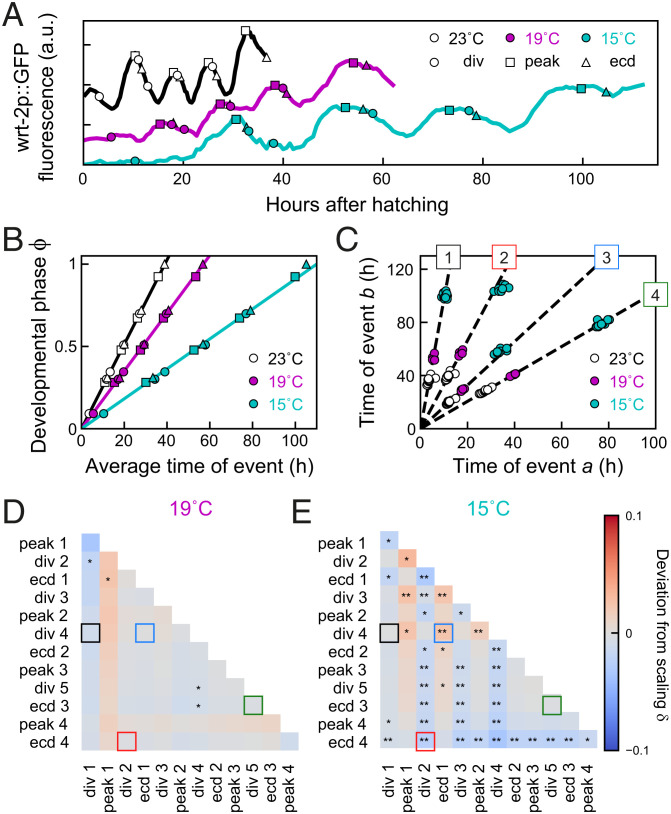
Fig. 2.
Temporal scaling of developmental timing at different temperatures. (A) Examples of timing in individual animals at standard conditions (23 °C, black), 19 °C (magenta), and 15 °C (cyan). (B) Developmental phase as function of time for different temperatures. Developmental progression is modeled as the time evolution of a developmental phase . Each developmental event occurs at a specific phase , where and are the population-averaged time of event and of total duration of development under standard conditions. The phase for standard conditions (black line) increases linearly with rate . Markers indicate events as in A. For 19 °C or 15 °C, the phase increases linearly with the average measured event times, albeit at a lower rate compared to 23 °C. Solid lines are fits to the “Uniform” model (defined in Fig. 3). (C) Measured times for different event pairs: 1, divisions 1 and 4; 2, division 2 and ecdysis 4; 3, ecdysis 1 and division 4; and 4, division 5 and ecdysis 3. Lines are a linear fit to data for standard conditions. Event pair times for different temperatures cluster along the same line; that is, all events occurred at the same time relative to the total duration of development. (D and E) Deviation from scaling for development at (D) 19 °C and (E) 15 °C. In addition, stars indicate the probability that data for standard conditions and 19 °C or 15 °C observe the same scaling relation, as assessed by a Kolmogorov–Smirnov (K-S) test: **P < 0.001, *P < 0.01, and not significant (N.S.) otherwise. At 19 °C, temporal scaling was observed for all event pairs, while some significant deviations were seen at 15 °C. Colored squares correspond to event pairs in C.

