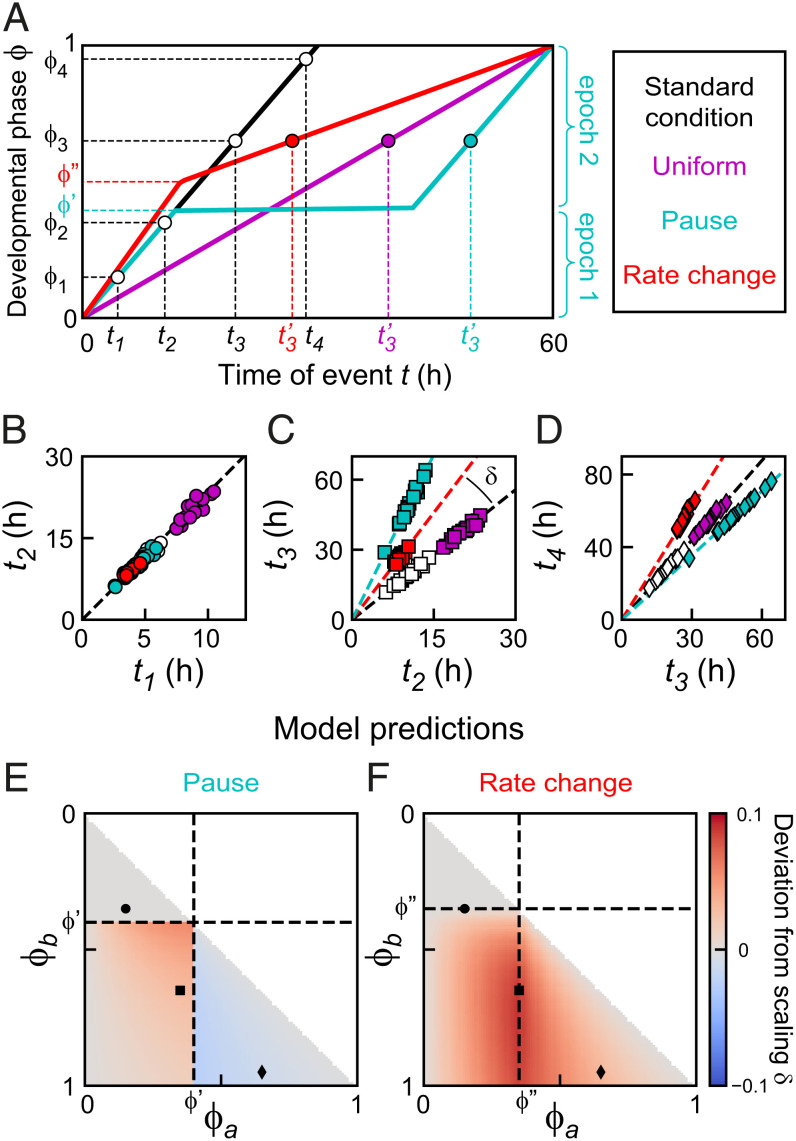
Fig. 3.
Timing models. (A) Developmental phase versus time for three different models that generate the same increase in duration of development: a uniform lower developmental rate (magenta), a single pause at (cyan), or a single change in developmental rate at (red) (SI Appendix, section S5; parameters chosen for clarity). For the “Pause” and “Rate change” models, the discontinuity in developmental rate results in two epochs of constant developmental rate, as illustrated for the “Pause” model. (B–D) Simulated event times for the event pairs indicated in A. Color indicates the timing model. For all models, event pair times cluster along a line; that is, they occur at the same time when rescaled by each individual’s duration of development. For the “Uniform” model, times of event pairs lie along the scaling line for standard conditions (dashed line): that is, they occur at the same time when rescaled by total duration of development. Other models generally deviate from this scaling line. The deviation from scaling is defined as the signed angle between these two lines, as indicated in C. (E and F) Predicted values of for different events pairs and for the (E) “Pause” and (F) “Rate change” models, based on measured parameters (SI Appendix, sections S6 and S8). Markers are the event pairs in B–D. The timing models in A can be distinguished by measuring .

