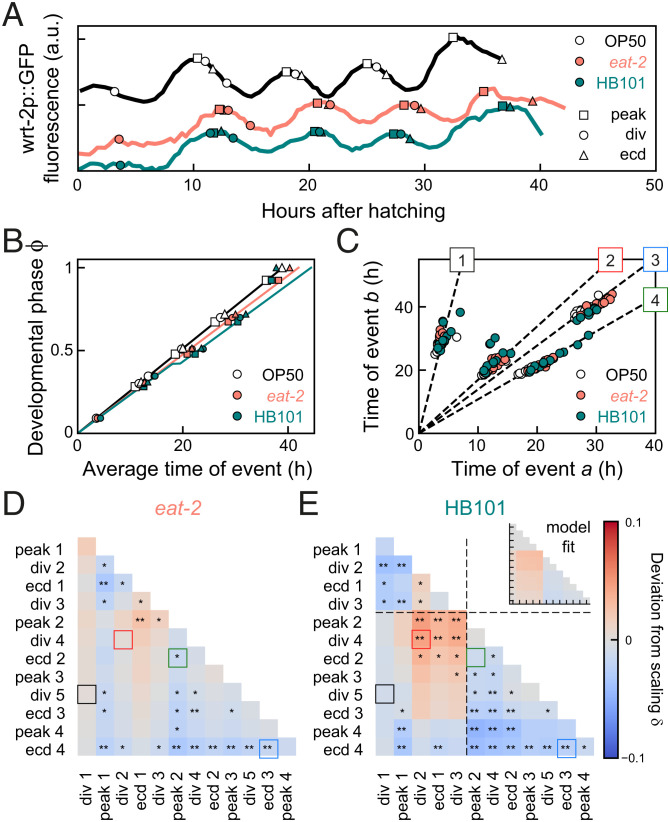
Fig. 4.
Temporal scaling for changes in diet. (A) Developmental timing in individual animals under standard conditions (black) and two conditions that exhibit slower development: wild-type on E. coli HB101 (green) and eat-2 mutants, that have reduced food uptake, on E. coli OP50 (orange). (B) Developmental phase versus time. Solid lines are best fits to the “Uniform” model (eat-2 mutants, orange line) and the “Pause” model (HB101 diet, green line) with a ∼2-h pause between division 3 and peak 2. (C) Measured times for event pairs: 1, divisions 1 and 5; 2, divisions 2 and 4; 3, peak 2 and ecdysis 2; and 4, ecdyses 3 and 4. Lines are the fit for standard conditions. For pairs 2 and 3, animals on HB101 deviate from this scaling line. (D and E) Deviation from scaling for (D) eat-2 mutants and (E) animals fed HB101. Stars indicate the probability that the data observe the scaling relation for standard conditions: **P < 0.001, *P < 0.01, and N.S. otherwise (K-S test). Lines in E indicate the fitted pause time. Inset shows best fit to the “Pause” model. Animals on HB101 exhibit systematic deviations from scaling that match the “Pause” model in sign and magnitude.

