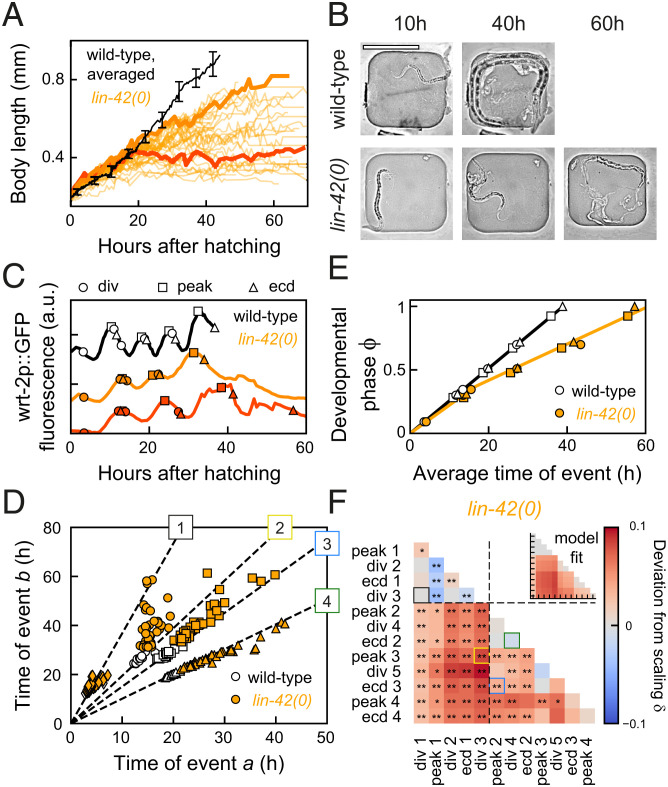
Fig. 5.
Growth arrest and temporal scaling in lin-42(0) animals. (A) Body length versus time for standard conditions (black, averaged, error bars are SEM) and lin-42(0) animals (orange lines, individual animals). The lin-42(0) animals exhibited either reduced growth or complete growth arrest (final body length of <0.5 mm) from the mid-L2 stage, ∼20 h after hatching. Thick lines highlight individuals with reduced (light orange) and arrested growth (dark orange). (B) Images of a wild-type (Top) and growth-arrested lin-42(0) larva (Bottom) at different times after hatching. (Scale bar: 200 µm.) (C) Timing in a wild-type larva (black), and in a slow-growing (light orange) and growth-arrested (dark orange) lin-42(0) animal, corresponding to the individuals highlighted in A. The growth-arrested animal executed most events that occur after mid-L2; that is, development was not arrested. (D) Measured times for event pairs: 1, divisions 1 and 3; 2, division 3 and peak 3; 3, peak 2 and ecdysis 3; and 4, division 4 and ecdysis 2. Lines are fits for standard conditions. The lin-42(0) animals show strong variability in timing between individuals and, for event pairs 2 and 3, exhibit clear deviations from the scaling line. (E) Developmental phase versus time in wild-type (black) and lin-42(0) animals (orange). The orange line is the best fit to the “Rate change” model, with wild-type developmental rate until mid-L2, and approximately twofold decreased afterward. (F) Deviation from scaling in lin-42(0) mutants. Stars indicate probability that lin-42(0) data observe the same scaling relation as wild-type: **P < 0.001, *P < 0.01, and N.S. otherwise (K-S test). Inset shows best fit to “Rate change” model. The data match the “Rate change” model, with lines indicating the fitted rate change time.

