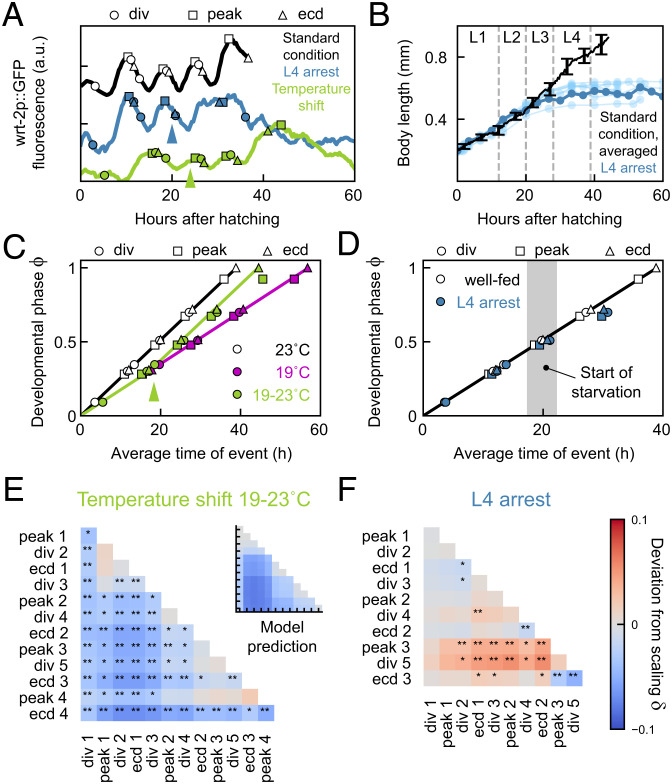
Fig. 6.
Loss of epochal organization upon condition shifts. (A) Developmental timing in a larva at standard conditions (black) and in animals shifted in temperature (green) or food abundance (blue). Arrows indicate time of the shift from 19 to 23 °C (green) or full depletion of food (blue). (B) Body length versus time for standard conditions (black, average, error bars are SEM) and animals shifted to no food (blue). Dark blue line corresponds to the individual in A. Gray lines indicate average ecdysis time for standard conditions. Animals arrest growth directly after depleting food in L3. (C) Developmental phase versus time in animals at 23 °C (black) and 19 °C (magenta), and in animals shifted from 19 to 23 °C (green). Arrow indicates the average time of the temperature shift. Green line is the “Rate change” model, assuming that development progresses at the 19 °C rate prior to the average shift time, and the 23 °C rate after. (D) Developmental phase versus time in well-fed animals (black) and animals shifted to no food (blue). Gray area indicates the time range at which the food supply was depleted. (E and F) Deviation from scaling for animals subjected to shift in (E) temperature or food (F) abundance. Stars indicate probability that the data observes the same scaling relation as standard conditions: **P < 0.001, *P < 0.01, and N.S. otherwise (K-S test). Inset in E shows the prediction of the “Rate change” model shown in C.

