Fig. 1.
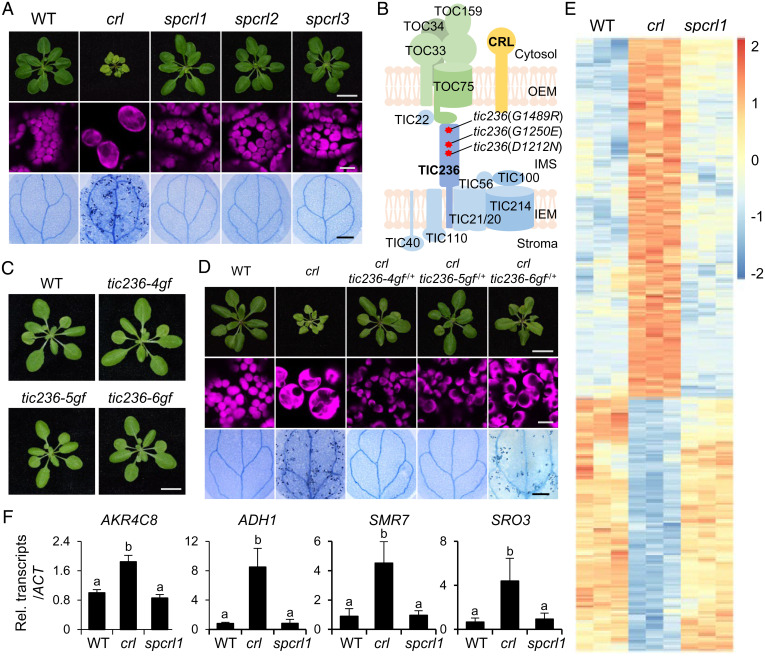
Identification of TIC236 gain-of-function mutations in spcrl mutants. (A) The micro and macroscopic phenotypes of the crl suppressors spcrl1, spcrl2, and spcrl3. (Top) Representative images of 21-d-old plants grown on soil. (Scale bar, 1 cm.) (Middle) Confocal images representing chlorophyll autofluorescence (magenta) of mesophyll cells. (Bottom) Cell death in 10-d-old cotyledons, as visualized by TB staining. (Scale bar, 0.5 mm.) (B) Whole-genome sequencing reveals the causative missense mutations in a single genetic locus encoding the TIC236 protein, as indicated by red asterisks. (C) Plant phenotypes of genetically isolated single mutants are shown. (Scale bar, 1 cm.) (D) Different levels of dominance for the D1212N (TIC236-4GF), G1250E (TIC236-5GF), and G1489R (TIC236-6GF) mutations are shown in each tic236-4gf, tic236-5gf, and tic236-6gf heterozygote (−/+) in the crl null mutant background. (Scale bars, 1 cm, 10 μm, and 0.5 mm, respectively.) (E) Heatmap showing the differentially expressed genes in crl versus WT and spcrl1 plants. The genes with at least a twofold change in expression and a FDR of less than 0.05 were selected. The colors of the heatmap represent the z-scores ranging from −2.0 (blue) to 2.0 (red). (F) The relative expression levels of selected crl-induced genes (versus WT) were analyzed in spcrl1 mutant seedlings using qRT-PCR. These genes include AKR4C8 (ALDO-KETO REDUCTASE FAMILY 4 MEMBER C8), ADH1 (ALCOHOL DEHYDROGENASE 1), SMR7 (SIAMESE-RELATED 7), and SRO3 (SIMILAR TO RCD ONE 3). ACTIN2 (ACT2) was used as an internal control. The result is presented as the mean ± SD of three replicates. Lowercase letters indicate statistically significant differences between mean values for each genotype (P < 0.05, ANOVA with post hoc Tukey’s honest significant difference test).

