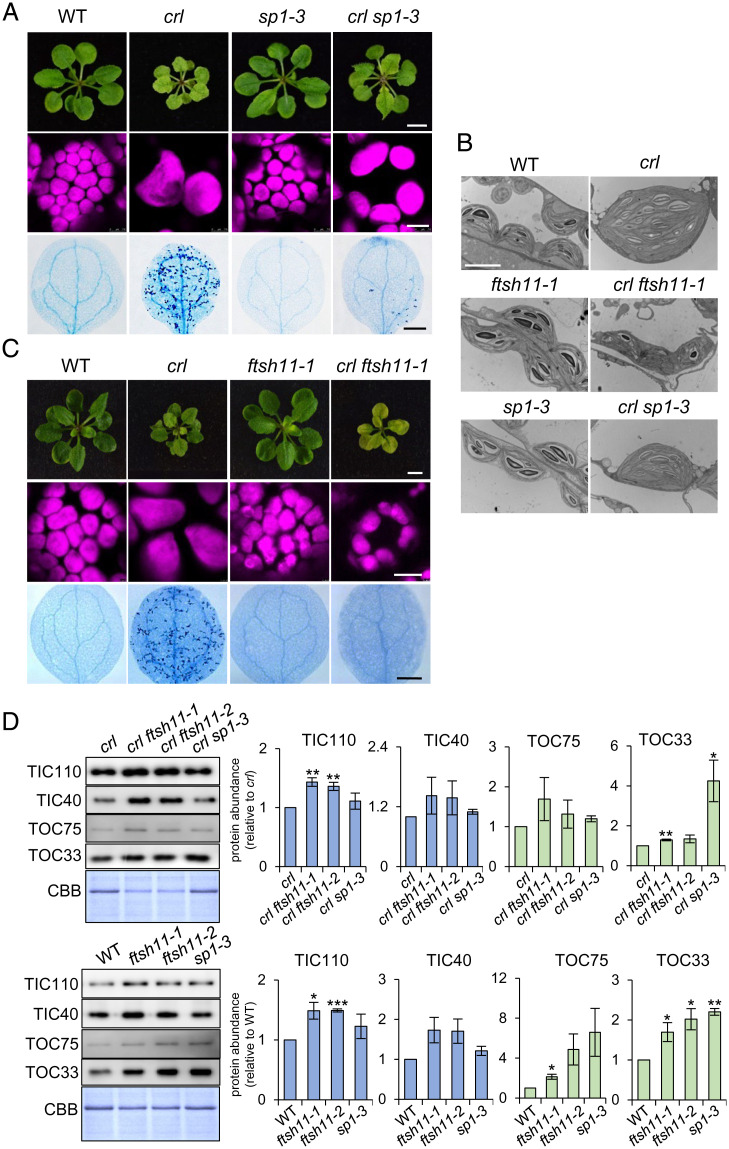
Fig. 5.
Loss of either SP1 or FTSH11 significantly rescues the crl phenotypes. (A and C) Images representing 21-d-old plants (Top), chloroplasts in mesophyll cells (Middle), and cell death in cotyledons (Bottom) are shown. (Scale bars: Top, 5 mm; Middle, 10 µm; Bottom, 0.5 mm.) (B) The chloroplast ultrastructure of 5-d-old seedlings was monitored by transmission electron microscopy. (Scale bar, 5 µm.) (D) From the same plant materials as in A and C, equal amounts of total protein were separated on SDS-PAGE gels and immunoblotted with the antibodies as indicated to detect the relative abundance of TIC and TOC proteins. The quantified protein abundance is shown as mean ± SD of three independent biological repeats after normalization to crl or WT of the same experiments. The significance of P values is obtained from Student’s t tests (two-tailed). *P < 0.05, **P < 0.01, ***P < 0.001. CBB staining of the SDS-PAGE gels is shown as a loading control.

