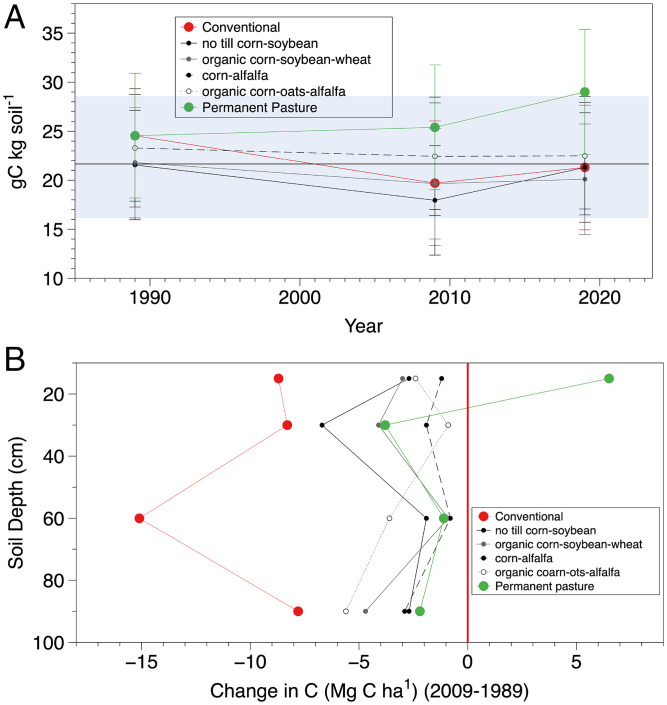
Fig. 2.
(A) The C concentration in the upper 30 cm of the six major treatments in the WICST (7, 8). An uncertainty of 26% is used, based on estimates from Sanford et al. (8). The solid line is the average of three soils sampled by the NRCS in 1962 in the vicinity of the study, and the shaded region represents the SD. (B) Change in soil profile C storage in the first 10 y of the study (data are from ref. 8).

