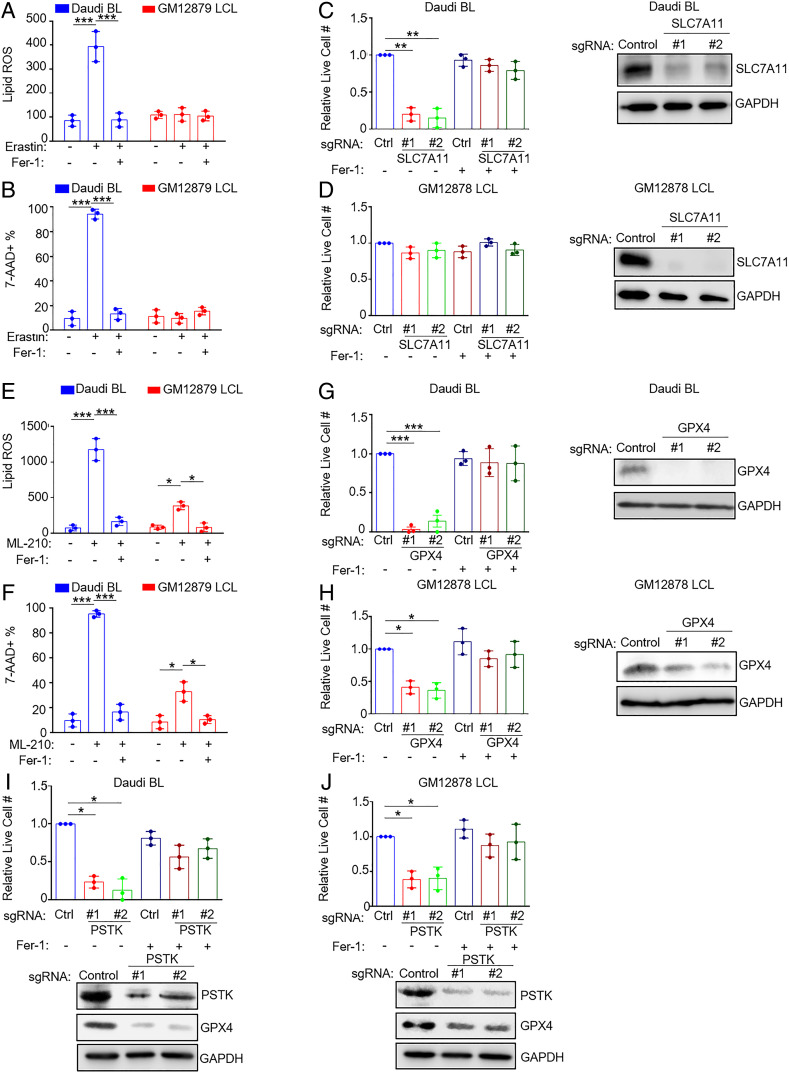
Fig. 3.
EBV-infected BL cells are more susceptible to ferroptosis inducing agents than lymphoblastoid cell lines. (A) BODIPY mean fluorescence intensity (MFI) + SD values from n = 3 independent replicates of Daudi BL versus GM12879 LCLs treated with erastin (10 μM) for 18 h and measured by FACS. (B) %7-AAD+ mean + SD values from n = 3 replicates of Daudi and GM12879 cells treated with erastin (10 μM) for 24 h and measured by FACS. (C and D) Relative mean + SD live cell numbers from CellTiter-Glo analysis from n = 3 replicates of Cas9+ Daudi (C) versus GM12878 LCLs (D) after 7 d of control (ctrl) or independent SLC7A11 single guide RNA (sgRNA) expression in the absence or presence of 5 μM Fer-1 as indicated. Shown at Right are representative immunoblots of whole-cell lysates (WCL) for SLC7A11 or GAPDH load control. (E) BODIPY MFI + SD values from n = 3 independent replicates of Daudi BL versus GM12879 LCLs treated with ML-210 (1 μM) for 18 h. (F) 7-AAD+ mean + SD values from n = 3 replicates of Daudi and GM12879 cells treated with ML-210 (1 μM) for 24 h and measured by FACS. (G and H) Relative mean + SD live cell numbers from CellTiter-Glo analysis from n = 3 replicates of Cas9+ Daudi (G) versus GM12878 LCLs (H) after 7 d of ctrl or GPX4 sgRNA expression in the absence or presence of 5 μM Fer-1 as indicated. Shown at Right are representative immunoblots of WCL for GPX4 or GAPDH load control. (I and J) Relative mean + SD live cell numbers from CellTiter-Glo analysis from n = 3 replicates of Cas9+ Daudi (I) versus GM12878 LCLs (J) after 7 d of ctrl or PSTK sgRNA expression in the absence or presence of 5 μM Fer-1 as indicated. Shown at Right are representative immunoblots of WCL for PSTK or GAPDH load control. P values were determined by one-sided Fisher’s exact test. *P < 0.05, **P < 0.005, ***P < 0.0005.

