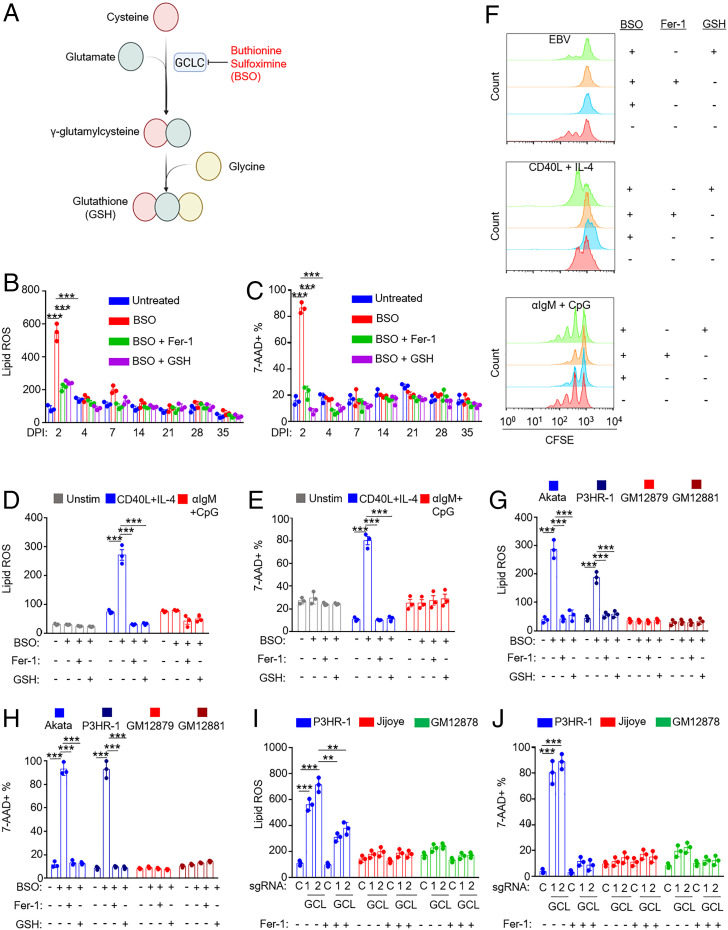
Fig. 5.
Effects of glutathione synthesis inhibition on EBV-infected, receptor-stimulated, and EBV-transformed B cells. (A) Diagram of the glutathione synthesis pathway and its inhibition by BSO. (B) FACS BODIPY MFI + SD values from n = 3 replicates of primary B cells treated at the indicated day post-EBV infection with BSO (100 µM) and Fer-1 (5 μM) or 2.5 mM GSH for 72 h as indicated. (C) %7-AAD+ mean + SD values from n = 3 replicates of primary B cells treated at the indicated day post-EBV infection with BSO (100 µM) and Fer-1 (5 μM) or 2.5 mM GSH for 72 h as indicated. (C) FACS %7-AAD+ mean + SD values from n = 3 independent replicates of primary B cells from independent donors treated at indicated day post-EBV infection with BSO (100 µM) and Fer-1 (5 μM) or 2.5 mM GSH for 72 h as indicated. (D) FACS BODIPY MFI + SD values from n = 3 independent replicates of primary B cells from independent donors stimulated for 2 d by CD40L (50 ng/mL) and IL-4 (20 ng/mL) or αIgM (1 μg/mL) and CpG (1 μM) and then treated with BSO (100 μM), 5 μM Fer-1, or 2.5 mM GSH for 48 h prior to analysis as indicated. (E) FACS %7-AAD+ mean + SD values from n = 3 independent replicates of primary B cells from independent donors stimulated for 2 d by CD40L (50 ng/mL) and IL-4 (20 ng/mL) or αIgM (1 μg/mL) and CpG (1 μM) and then treated with BSO (100 μM), 5 μM Fer-1, or 2.5 mM GSH for 48 h prior to analysis as indicated. (F) FACS analysis of carboxyfluorescein succinimidyl ester–labeled primary B cells infected with EBV or treated with the indicated stimuli in the presence of BSO, Fer-1, or GSH, as indicated. After 4 d, proliferation was analyzed via FACS. Plot is representative of n = 3 independent replicates. (G) FACS BODIPY MFI + SD values from n = 3 independent replicates of EBV-Akata and EBV+ P3HR-1 BL or GM12879 and GM12881 LCLs treated with BSO (100 µM), Fer-1 (5 µM), or GSH (2.5 mM) for 48 h as indicated. (H) FACS %7-AAD+ mean + SD values from n = 3 independent replicates of EBV-Akata and EBV+ P3HR-1 BL or GM12879 and GM12881 LCLs treated with BSO (100 µM), Fer-1 (5 µM), or GSH (2.5 mM) for 72 h as indicated. (I). FACS BODIPY MFI + SD values from n = 3 independent replicates of Cas9+ latency I P3HR-1, latency III Jijoye, or GM12878 LCLs expressing control (c) or GCLC (GCL) sgRNAs for 12 d and treated with Fer-1 (5 µM), as indicated. (J) FACS %7-AAD+ mean + SD values from n = 3 independent replicates as in I, analyzed 14 d after single guide RNA expression. P values were determined by one-sided Fisher’s exact test. *P < 0.05, **P < 0.005, ***P < 0.0005.

