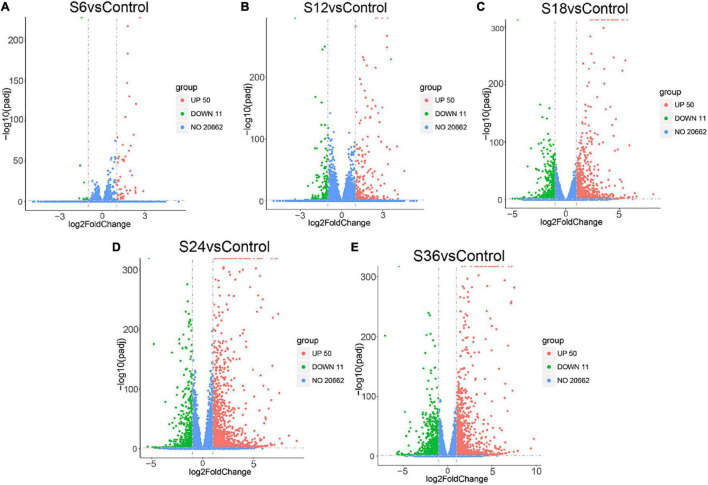
FIGURE 1.
Volcano plots of the DEGs in five comparison groups. Red indicates up-regulated DEGs, green indicates down-regulated DEGs, and blue indicates unchanged DEGs. (A) S6 vs. Control. (B) S12 vs. Control. (C) S18 vs. Control. (D) S24 vs. Control. (E) S36 vs. Control. Control: PK-15 cells at 0 h SVA post-infection groups; S6_1-3: PK-15 cells at 6 h SVA post-infection groups; S12_1-3: PK-15 cells at 12 h SVA post-infection groups; S18_1-3: PK-15 cells at 18 h SVA post-infection groups; S24_1-3: PK-15 cells at 24 h SVA post-infection groups; S36_1-3: PK-15 cells at 36 h SVA post-infection groups.

