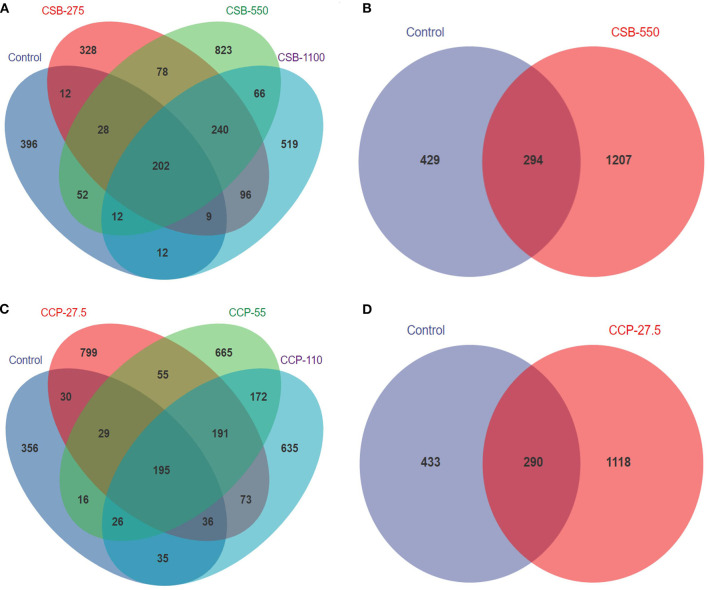
Figure 1.
The number of shared and specific operational taxonomic units (OTUs) in each group. Each circle represents one group; the number in the overlapping portion of the circles represents the number of shared OTUs between the different groups, and the number in the non-overlapping portion of the circles represents the OTUs specific to each group. (A) Between squabs fed the CSB diet and the control diet. (B) Between groups CSB-550 and control. (C) Between squabs fed the CCP diet and the control diet. (D) Between groups CCP-27.5 and control.

