Figure 4.
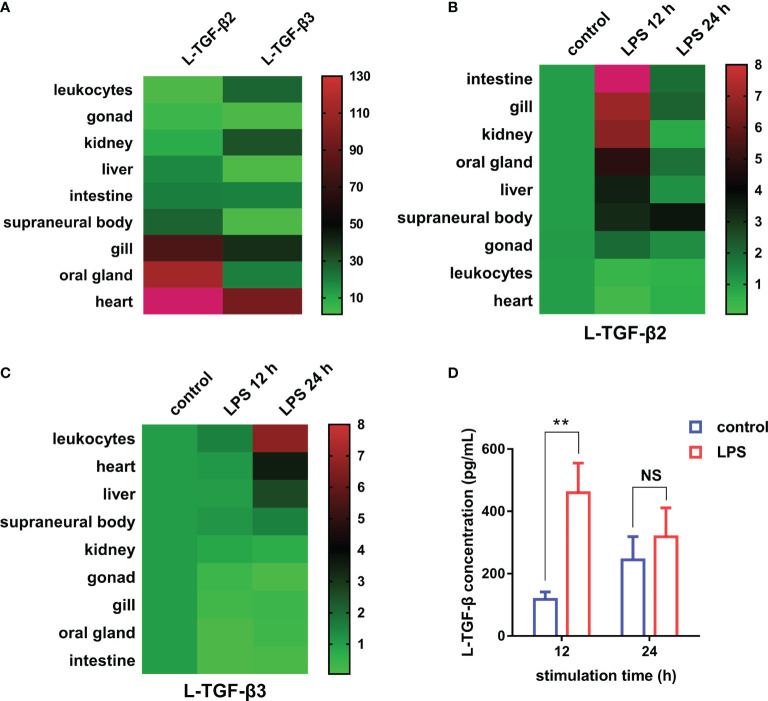
Expression profiles of TGF-βs in the Japanese lamprey. (A) Heatmap of the tissue distribution of L-TGF-β2 and L-TGF-β3 determined by real-time PCR. For L-TGF-β2, its relative expression level in leukocytes was set to 1, while for L-TGF-β3, its relative expression level in the liver was set to 1. Colorized matrixes highlight the high expressing tissues in red, the low expressing tissues in green and the median expression in black as shown in the color scale. (B, C) Heatmaps of the changes in L-TGF-βs expression levels before and after LPS immunization. The expression levels of L-TGF-β2 (B) and L-TGF-β3 (C) after 12 and 24 hours of LPS stimulation relative to those in unimmunized lampreys were analyzed using real-time PCR. The green and red in colorized matrixes indicate low to high expression levels, respectively. The experiments were repeated 3 times independently. (D) Changes in the level of L-TGF-β proteins secreted by SMB cells. The total amount of L-TGF-βs including the latent and activated forms in the supernatant of primary cultured SMB cells after 12 and 24 hours of in vitro LPS stimulation were determined using a customized sandwich ELISA kit. The standard curve is shown in Supplementary Figure 1 . Error bars represent mean ± SEM from three independent experiments. Statistical significance was calculated using a two-tailed unpaired t-test. **: p < 0.01, NS, Not significant.

