Figure 6.
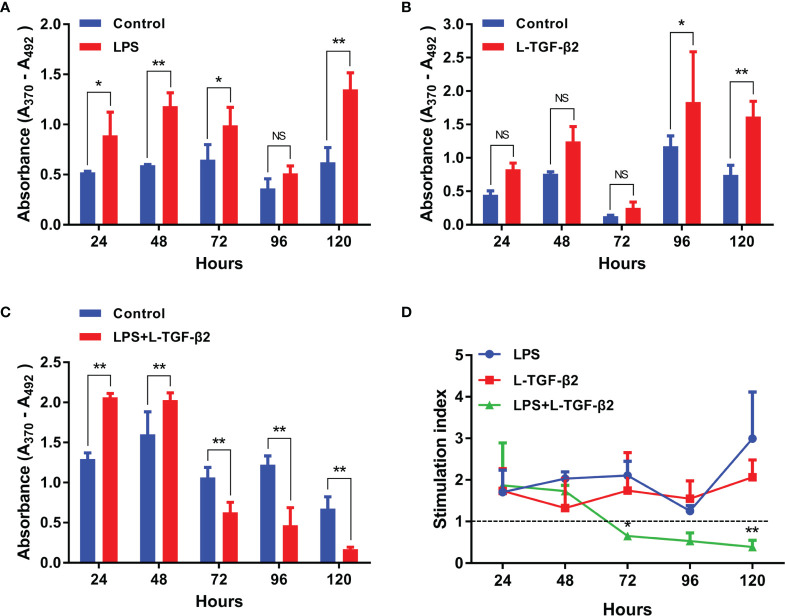
The effect of rL-TGF-β2 on the proliferation of quiescent and activated SMB cells in lampreys detected using the BrdU incorporation method. (A) The effect of LPS on the proliferation of SMB cells. The OD values are compared between the LPS-treated group with the control after 24, 48, 72, 96, and 120 h of incubation. (B) The effect of rL-TGF-β2 on the proliferation of quiescent SMB cells. The OD values are compared between the rL-TGF-β2-treated group with the control after 24 to 120 h of incubation. (C) The effect of rL-TGF-β2 on the proliferation of LPS-stimulated SMB cells. The OD values are compared between the rL-TGF-β2-treated group with the control after 24 to 120 h of incubation. In Figures (A–C), the statistical analyses are all performed by multiple t-tests, in which the statistical significance is determined using the Holm-Sidak method, with alpha = 0.05. *: Adjusted p < 0.05, **: Adjusted p < 0.01, NS, Not significant. All experiments were repeated thrice. (D) Trends in the stimulation index of SMB cells proliferation under different treatment conditions. Two-way RM ANOVA is used for statistical analysis. Treatment condition: F (2, 6) = 17.56, P = 0.0031; Treatment time: F (4, 24) = 2.135, P = 0.1075; Interaction: F (8, 24) = 3.18, P = 0.0133. The LPS-treated group was subsequently set as the control for Dunnett’s multiple comparison test. LPS-treated group vs. LPS + rL-TGF-β2 co-treated group: *:P = 0.0072 (72 h), **:P < 0.0001 (120 h).

