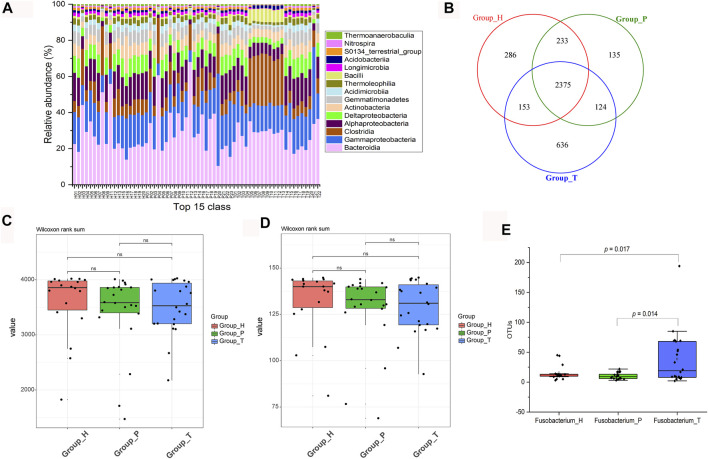
FIGURE 1.
Changes in microbial community and diversity. Relative abundance of the top 15 classes (H, healthy people; P, polyp patients; T, CRC patients) (A). Venn diagram of different groups (B). Comparation among observed species (C). Comparation among phylogenetic diversity (D). Absolute abundance (OTU numbers) of Fusobacterium in different groups (E).

