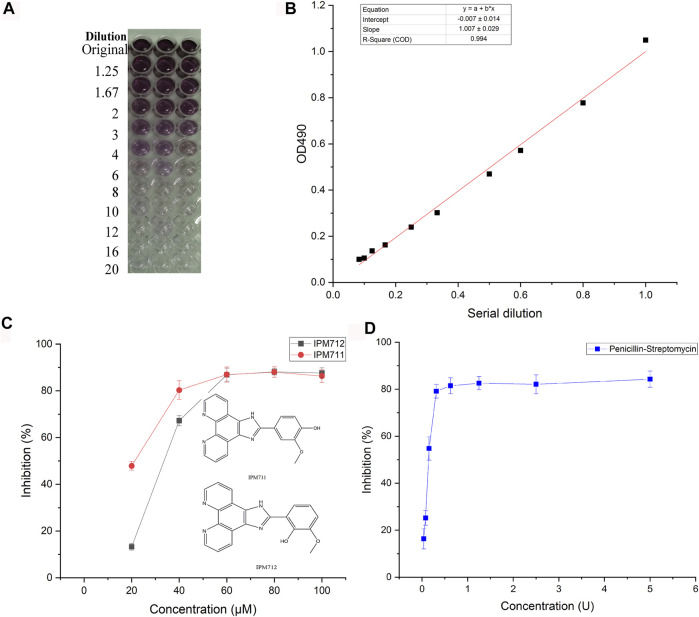
FIGURE 2.
Anti-F. nucleatum activities of IPM711 and IPM712. Gradient changes in color in a 96-well plate at different F. nucleatum concentrations using the MTT method and corresponding standard curve at 490 nm (A,B). Inhibition rates of IPM711 (red point), IPM712 (black point), and penicillin–streptomycin (blue point) against F. nucleatum (C,D).

