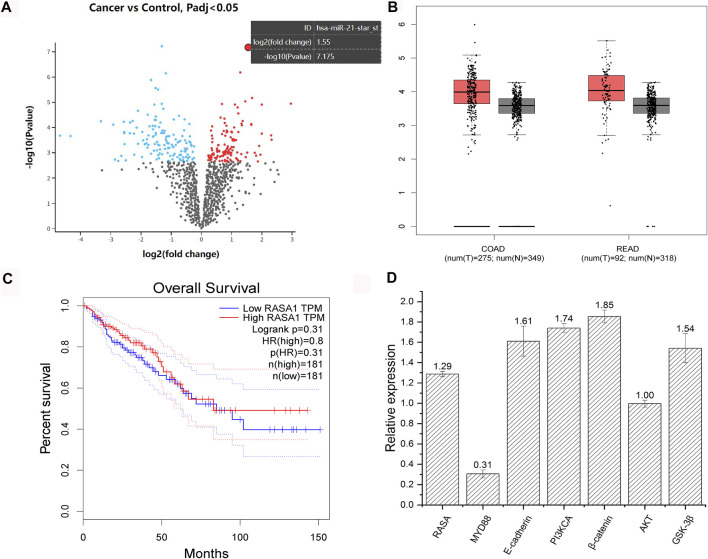
FIGURE 4.
Analysis of GSE122182 dataset and validation with qPCR. Volcano map of gene expression of colorectal cancer and the adjacent normal tissues infected with F. nucleatum (red points represent upregulated genes and blue points represent downregulated genes) (A). Expression difference of RASA gene between healthy people and CRC patients (COAD, colon cancer; RECD, rectal cancer; T, tumor patients; N, normal people) (B). Survival curve of patients with high and low expression of RASA gene (obtained from GEPIA, http://gepia.cancer-pku.cn/) (C). Changes in gene expressions of HCT116 after coculture with F. nucleatum (numbers represent the fold change in gene expression) (D).

