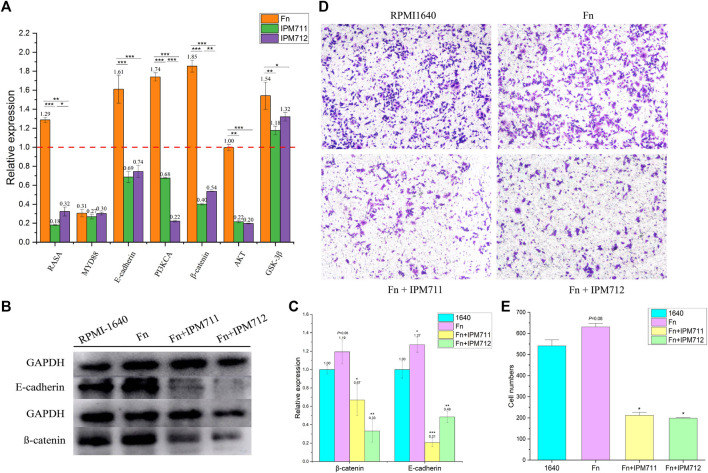
FIGURE 5.
Changes in gene and protein expression. Changes in related genes of HCT116 after cocultivation with F. nucleatum (Fn, MOI = 100, 2 h) and treatments with IPM711 and IPM712 at the concentration of IC50 (A). Changes in E-cadherin and β-catenin proteins of HCT116 after cocultivation with F. nucleatum (MOI = 100, 2 h) and treatments with IPM711 and IPM712 (IC50) (B). Statistical analysis, *p < 0.05, **p < 0.01, ***p < 0.001 compared with control group (C). Characterization of migratory capacity of HCT116 cells after treatment with RPMI-1640, F. nucleatum, F. nucleatum and IPM711, and F. nucleatum and IPM712 (D). Statistical analysis, *p < 0.05 compared with control group (E).

