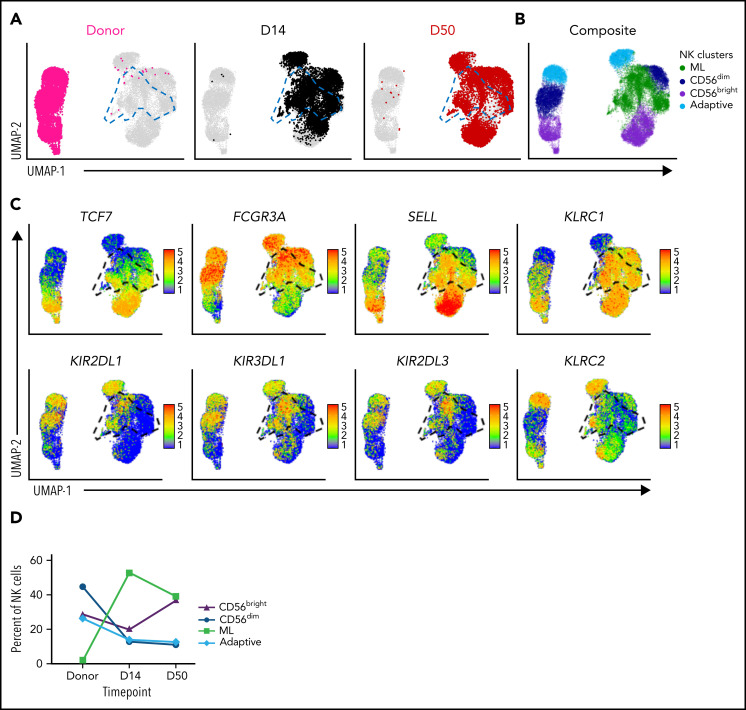
Figure 4.
ML NK cells express a unique transcriptional signature in vivo. Single-cell RNA sequencing was performed on enriched NK cells at baseline (donor) and at time points after infusion of cells from patient samples. NK cell subpopulations were identified by unsupervised cluster analysis. Data are shown for peripheral blood for P-ML008. (A) UMAP visualization of NK cells at the indicated time points. Panels are colored by time point overlaid on composite data from all time points (gray). ML NK cells are outlined with blue dashed lines on the UMAPs. (B) UMAP of indicated NK cell populations within composite data from all time points in panel A. (C) Expression of key NK cell population identifying genes. Cells shown in order on the UMAP by expression level. Black gate denotes ML NK cell population. (D) Percentage of CD56bright, CD56dim, ML, and adaptive NK cells in the donor product (baseline, before infusion) and days 14 and 50 after infusion. UMAP, Uniform Manifold Approximation and Projection.

