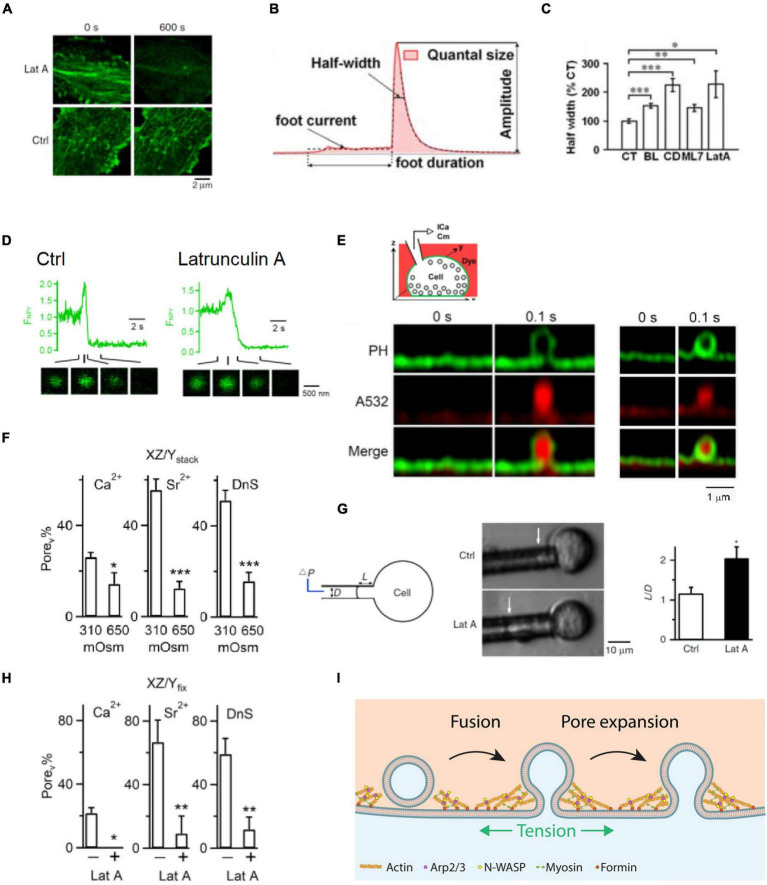
FIGURE 3.
F-actin promotes fusion pore expansion by enhancing plasma membrane tension. (A) Latrunculin A (Lat A) reduces F-actin: sampled Lifeact-labeled F-actin at the cell bottom of bovine adrenal chromaffin cells before (0 s, left) and 600 s after (right) application of Lat A (3 μM) or a control (Ctrl) solution. (B) A single amperometric spike along with the five parameters: quantal size Q (pC), half-width (ms), peak amplitude (pA), foot signal duration (ms), and mean foot current (pA). (C) Half-width (mean ± SEM) of amperometric spikes in control (CT) or in the presence of blebbistatin (BL), cytochalasin D (CD), ML-7 (ML7), or Lat A. Data normalized to the mean in control. *p < 0.05; **p < 0.01; ***p < 0.001 (t-test). (D) Lat A slows down neuropeptide Y-EGFP (NPY-EGFP) release from single vesicles: fluorescence of NPY-EGFP (FNPY) from single vesicles in Ctrl (left) and in the presence of Lat A (right). Decay indicates release of neuropeptide Y-EGFP. NPY-EGFP images at times indicated are also shown. The initial increase of NPY-EGFP fluorescence is due to fusion pore opening that increases the vesicular lumen pH. (E) Top: setup drawing. Cell membrane is labeled with the phospholipase C ΔPH domain attached with mNeonGreen (PHG, green), whereas the bath solution contains Atto 532 (A532, red, pseudo-color). Bottom left: STED PHG/A532 images immediately before (time 0) and after fusion during imaging every 0.1 s. PHG-labeled fusion pore is visible. The stimulation was a depolarization from –80 to +10 mV for 1 s (depol1 s). Bottom right: similar to left panel but showing a pore not visible to STED microscopy. (F) The percentage of fusion pores induced by depol1s that are visible to STED microscopy (Porev%) at 310 or 650 mOsm (bath solution) in calcium (Ca2+), strontium (Sr2+), or dynasore (DnS, with 5 mM Ca2+). Porev was detected with PHG STED imaging as shown in E. Data show that 650 mOsm reduces Porev%. (G) Latrunculin A (Lat A) reduces membrane tension. Left: drawings of the micropipette aspiration technique. Negative pressure (ΔP) in the pipette (with a diameter D) draws the cell membrane into the pipette by a length L. Middle: pipette-aspirated cells (bright-field images) in the absence (Ctrl) and presence of Lat A (0.5 μM). Arrows indicate membrane projection (L) into the micropipette (ΔP = 500 Pa). Right: normalized projection length (L/D, mean + SEM) for aspirated cells in the absence (Ctrl) or presence of Lat A (0.5 μM). *p = 0.011 (t-test). (H) Lat A inhibits Porev (fusion pore visible to STED microscopy) percentage: the percentage of Porev (Porev%) in the absence (–) or presence (+) of 3 μM Lat A in a bath containing Ca2+, Sr2+, or DnS. Porev was detected with STED imaging of PHG as shown in panel E. (I) Schematic drawing showing that F-actin cytoskeleton enhances plasma membrane tension and thus promotes fusion pore expansion that releases vesicular contents rapidly and completely. Promotion of fusion pore expansion does not necessarily flatten the fusion pore, explained in more detail in Figure 4. Panels A,D,G are adapted from Wen et al. (2016) with permission. Panels B,C are adapted from Berberian et al. (2009) with permission. Panel E,F,H are adapted from Shin et al. (2018) with permission.

