Figure 4.
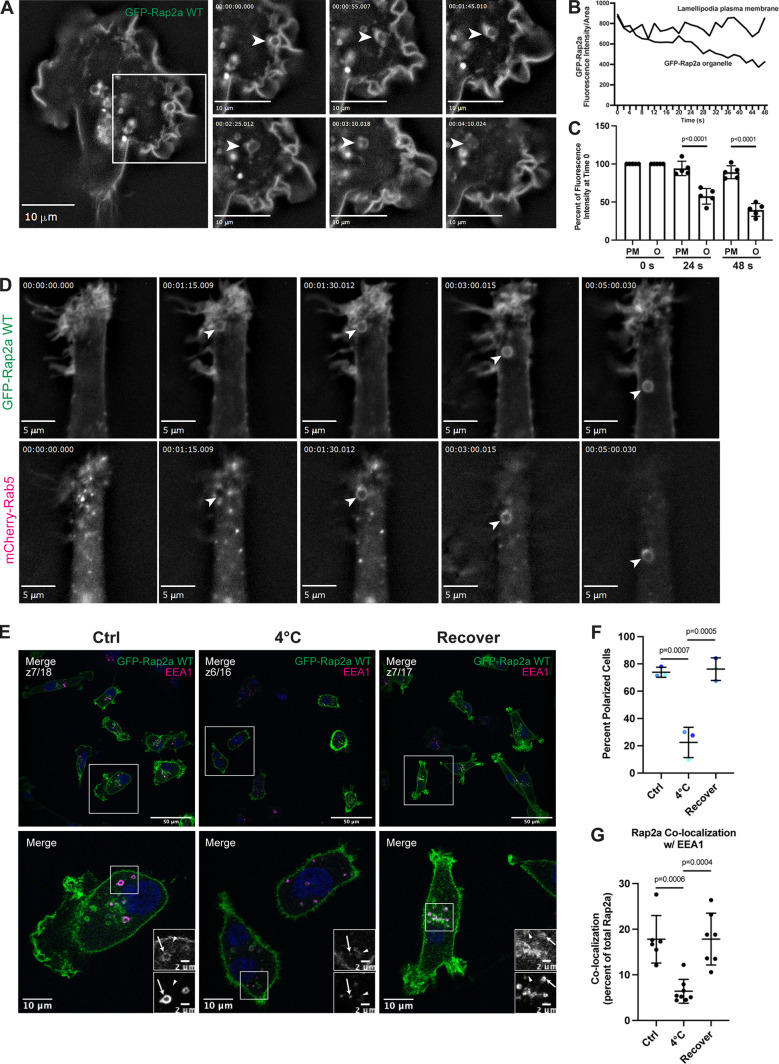
Rap2 is enriched at the lamellipodia leading edge, where its internalization and recycling to the plasma membrane are important for cell migration. (A) Live imaging of GFP-Rap2a in MDA-MB-231 cells. Cells stably expressing GFP-Rap2a were plated on a collagen-coated glass dish and imaged every 5 s using a 63× objective. Widefield microscope. Still images are shown. Arrowheads point to an example of GFP-Rap2a internalization over time from the plasma membrane in macropinosome-like vesicles. We also note that GFP-Rap2a organelle decreases in fluorescence intensity over time. See Video 4. Scale bars, 10 µm. (B) Linescan analysis of internalized GFP-Rap2a organelle. A circular line was drawn around the GFP-Rap2a organelle marked in Fig. 4 A, and fluorescence intensity/area was measured at each time point (every 2 s). The same thing was done with a linescan at the plasma membrane. The fluorescence intensity of GFP-Rap2a around the organelle line and at the plasma membrane is plotted as fluorescence intensity/area (µ2) across 48 s. (C) Same analysis as in B, but more organelles quantified. As in B, linescans were drawn both around the GFP-Rap2a organelles (see Materials and methods for criteria) and at the lamellipodia plasma membrane. The intensity of GFP-Rap2a in each pixel along these lines was determined with either ImageJ or 3i Slidebook imaging software. Fluorescence intensity/area (µ2) at 0 s (start of time-lapse), 24 s (half of time-lapse), and 48 s (end of time-lapse) was plotted for all five organelles as a percentage of time 0. Statistical analysis (one-way ANOVA with Tukey’s multiple comparisons test) was used to compare fluorescence intensity changes between the plasma membrane and internalized organelles. Mean ± SD. PM, plasma membrane; O, organelle. PM versus O at 24 s, P < 0.0001; PM versus O at 48 s, P < 0.0001. (D) Live imaging of GFP-Rap2a and mCherry-Rab5 in MDA-MB-231 cells. Cells stably expressing GFP-Rap2a were transiently transfected with mCherry-Rab5, plated on a collagen-coated glass dish, and imaged every 5 s using a 63× objective. Widefield microscope. Still images are shown. Arrowhead points to one example of a GFP-Rap2a internalized organelle over time, which becomes mCherry-Rab5 positive soon after internalization from the plasma membrane. See Video 6. Scale bars, 5 µm. (E) Endocytosis cold block experiment. Three conditions were set up using MDA-MB-231 cells stably expressing GFP-Rap2a: (1) 37°C (Ctrl). (2) 4°C for 60 min. (3) 4°C for 60 min followed by 37°C for 40 min (Recover). Cells were fixed and stained for EEA1 (magenta) and DAPI (blue). Scale bars, 50, 10, and 2 µm. Arrows indicate examples of GFP-Rap2a and EEA1 overlap. Arrowheads point to GFP-Rap2a organelles that are not EEA1 positive. (F) Percentage of polarized cells quantification from cold block experiment in E. Ctrl, 4°C, and Recover cells were scored for polarized versus nonpolarized cells. Briefly, polarized cells had enrichment of Rap2 at the lamellipodia (see Materials and methods). Three biological replicates were performed. Eight fields of view were taken for each n, with approximately six cells in each field. Graph shows percentage of polarized cells for each condition (color coded). Mean ± SD. One-way ANOVA with Tukey’s multiple comparisons test. Ctrl versus 4°C, P = 0.0007; 4°C versus Recover, P = 0.0005. (G) Quantification of colocalization between GFP-Rap2a and EEA1 in Ctrl versus 4°C versus Recover cells. Cells stably expressing GFP-Rap2a were fixed and stained with EEA1. 3i SlideBook6 software was used to calculate the percentage of total GFP-Rap2a that colocalized with EEA1. One biological replicate was performed; n = 6 for Ctrl cells, n = 8 for 4°C cells, n = 7 for Recover cells. One-way ANOVA with Tukey’s multiple comparisons test. Ctrl versus 4°C, P = 0.0006; 4°C versus Recover, P = 0.0004.

