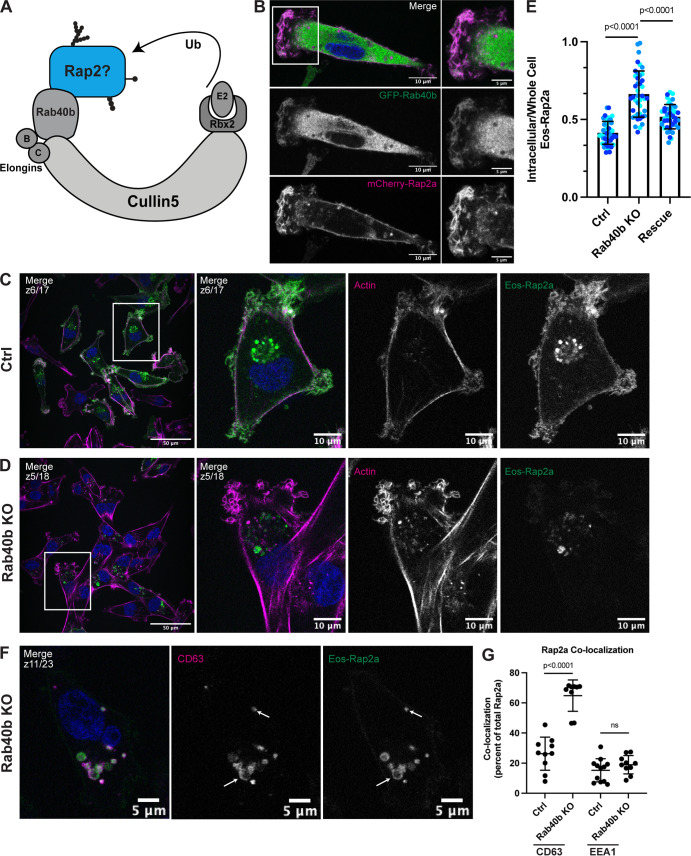
Figure 6.
Loss of Rab40b results in a Rap2 sorting defect that leads to decreased Rap2 at the plasma membrane. (A) Rap2 is a putative substrate of the mammalian Rab40b/Cul5 complex. (B) Colocalization of GFP-Rab40b and mCherry-Rap2a. MDA-MB-231 cells stably expressing GFP-Rab40b were transiently transfected with mCherry-Rap2a, then fixed and stained with DAPI (blue). Scale bars, 10 and 5 µm. (C) Eos-Rap2a localization in Ctrl cells. Ctrl cells in this case are MDA-MB-231 parental cells. Eos-Rap2a has the same localization in MDA-MB-231 parental cells versus Cas9 cells (not depicted). MDA-MB-231 cells stably expressing Eos-Rap2a were fixed and stained with phalloidin (magenta) and DAPI (blue). Scale bars, 50 and 10 µm. (D) Eos-Rap2a localization in Rab40b KO cells. Rab40b KO MDA-MB-231 cells stably expressing Eos-Rap2a were fixed and stained with phalloidin (magenta) and DAPI (blue). Scale bars, 50 and 10 µm. (E) Intracellular to whole-cell fraction quantification, Eos-Rap2a in Ctrl versus Rab40b KO versus Rab40b KO Rescue cells. Rab40b KO Rescue cells overexpress FLAG-Rab40b WT (stable population line; see Fig. S1 E). Three biological replicates were performed for each cell line. In each biological replicate, five fields of view were imaged, with 3 cells analyzed from each field (total of 15 cells per n). The three shades of blue represent each set of 15 cells from n1, n2, and n3. Each cell was treated as its own data point, and statistical analysis (one-way ANOVA with Tukey’s multiple comparisons test) was performed with n = 45 total for each condition. Mean ± SD. Eos-Rap2a in Ctrl cells versus Eos-Rap2a in Rab40b KO cells, P < 0.0001; Eos-Rap2a in Rab40b KO cells versus Eos-Rap2a in Rab40b KO Rescue cells, P < 0.0001. ROUT outlier test removed three outliers from Rab40b KO data set. Ctrl cells in this experiment are MDA-MB-231 parental cells. (F) Eos-Rap2a colocalization with CD63 in Rab40b KO cells. Rab40b KO MDA-MB-231 cells stably expressing Eos-Rap2a were fixed and stained with the lysosomal marker CD63 (magenta) and DAPI (blue). Arrows indicate examples of Eos-Rap2a and CD63 overlap. Scale bars, 5 µm. (G) Quantification of colocalization between Rap2a and CD63/EEA1 in Ctrl versus Rab40b KO cells. Ctrl or Rab40b KO cells stably expressing Eos-Rap2a were fixed and stained with either CD63 (late endosomes/lysosomes) or EEA1 (early endosomes). 3i SlideBook6 software was used to calculate the percentage of total GFP-Rap2a that colocalizes with the markers indicated (see Materials and methods). Two biological replicates were performed, with approximately five cells imaged for each replicate. n = 10 Ctrl CD63, n = 9 KO CD63, n = 12 Ctrl EEA1, n = 10 KO EEA1. One-way ANOVA with Tukey’s multiple comparisons test. Ctrl versus Rab40b KO CD63, P < 0.0001; Ctrl versus Rab40b KO EEA1, ns.

