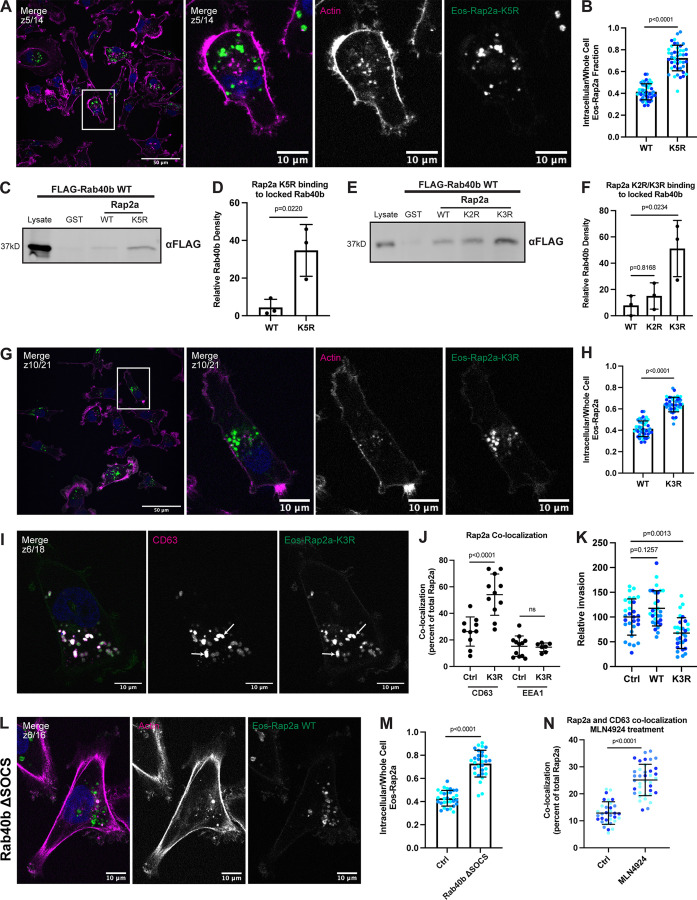
Figure 8.
Mutation of five putative ubiquitylation sites within Rap2 affects recycling, subcellular localization, binding to Rab40b, and cell invasion. (A) Eos-Rap2a-K5R localization. MDA-MB-231 cells stably expressing Eos-Rap2a-K5R were fixed and stained with phalloidin (magenta) and DAPI (blue). Scale bars, 50 and 10 µm. (B) Intracellular to whole-cell fraction quantification, Eos-Rap2a-WT versus Eos-Rap2a-K5R. Three biological replicates were performed for each cell line. In each biological replicate, five fields of view were imaged, with 3 cells analyzed from each field (total of 15 cells per n, color coded). Each cell was treated as its own data point, and statistical analysis (unpaired t test) was performed with n = 45 total for each condition. Mean ± SD. Eos-Rap2a-WT versus Eos-Rap2a-K5R, P < 0.0001. Eos-Rap2a-WT data points are from Fig. 6 E. (C) Rap2a-K5R binding to Rab40b. MDA-MB-231 lysates stably expressing FLAG-Rab40b WT were incubated with GST, GST-Rap2a-WT, or -K5R, followed by GST pull-down. Before incubation, FLAG-Rab40b lysates were loaded with GMP-PNP. 25 µg of lysate input was loaded as a positive control and used to estimate pull-down efficiency. (D) Quantification of GST pull-down in C. Three biological replicates were performed. Mean ± SD. GST signal was subtracted from experimental lanes, and relative Rab40b density was calculated by normalizing to lysate. Unpaired t test. Rap2a-WT versus Rap2a-K5R, P = 0.0220. (E) Rap2a-K2R and Rap2a-K3R binding to Rab40b. MDA-MB-231 lysates stably expressing FLAG-Rab40b WT were incubated with GST, GST-Rap2a-WT, GST-Rap2a-K2R, or GST-Rap2a-K3R followed by a GST pull-down. Before incubation, FLAG-Rab40b lysates were loaded with GMP-PNP. 25 µg of lysate input was loaded as a positive control and used to estimate pull-down efficiency. (F) Quantification of GST pull-down in E. Three biological replicates were performed. Mean ± SD. GST signal was subtracted from experimental lanes, and relative Rab40b density was calculated by normalizing to lysate. One-way ANOVA with Tukey’s multiple comparisons test. Rap2a-WT versus Rap2a-K2R, P = 0.8168; Rap2a-WT versus Rap2a-K3R, P = 0.0234. (G) Eos-Rap2a-K3R localization. MDA-MB-231 cells stably expressing Eos-Rap2a-K3R were fixed and stained with phalloidin (magenta) and DAPI (blue). Scale bars, 50 and 10 µm. (H) Intracellular to whole-cell fraction quantification, Eos-Rap2a-WT versus Eos-Rap2a-K3R. Three biological replicates were performed for each cell line. In each biological replicate, five fields of view were imaged, with three cells analyzed from each field (total of 15 cells per n, color coded). Each cell was treated as its own data point, and statistical analysis (unpaired t test) was performed with n = 45 total for each condition. Mean ± SD. Eos-Rap2a-WT versus Eos-Rap2a-K3R, P < 0.0001. Eos-Rap2a-WT data points are from Fig. 6 E. (I) Eos-Rap2a-K3R colocalization with CD63. MDA-MB-231 cells stably expressing Eos-Rap2a-K3R were fixed and stained with the lysosomal marker CD63 (magenta) and DAPI (blue). Arrows indicate examples of Eos-Rap2a-K5R and CD63 overlap. Scale bars, 10 µm. (J) Quantification of colocalization between Rap2a and CD63/EEA1 in Ctrl versus K3R cells. MDA-MB-231s stably expressing either Eos-Rap2a WT or Eos-Rap2a K3R were fixed and stained with either CD63 (late endosomes/lysosomes) or EEA1 (early endosomes). 3i SlideBook6 software was used to calculate the percentage of total GFP-Rap2a that colocalizes with the markers indicated (see Materials and methods). Two biological replicates were performed, with approximately five cells imaged for each replicate. n = 10 Ctrl CD63, n = 11 K3R CD63, n = 12 Ctrl EEA1, n = 7 K3R EEA1. One-way ANOVA with Tukey’s multiple comparisons test. Mean ± SD. Ctrl versus K3R CD63, P < 0.0001; Ctrl versus K3R EEA1, ns. (K) Invasion assay quantification, Ctrl versus Eos-Rap2a WT versus Eos-Rap2a K3R. Three biological replicates were performed, with technical duplicates in each experiment. 5 fields of view were imaged for each Matrigel insert (resulting in 10 fields of view per experiment per condition, color coded). Raw number of cells invaded per field of view were normalized to Ctrl (relative invasion). Ctrl cells are MDA-MB-231 parental cells. Eos-Rap2a WT and K3R are stable overexpressed lines. Each field of view was treated as its own data point (n = 30). One-way ANOVA with Tukey’s multiple comparisons test. Mean ± SD. Ctrl versus Eos-Rap2a WT, P = 0.1257; Ctrl versus Eos-Rap2a K3R, P = 0.0013. (L) Eos-Rap2a localization in Rab40b ΔSOCS cells. Rab40b ΔSOCS MDA-MB-231 cells expressing Eos-Rap2a were fixed and stained with phalloidin (magenta) and DAPI (blue). Scale bars, 50 and 10 µm. (M) Intracellular to whole-cell fraction quantification, Eos-Rap2a in Ctrl cells versus Rab40b ΔSOCS cells. Two biological replicates were performed for each cell line. In each biological replicate, five fields of view were imaged, with 3 cells analyzed from each field (total of 15 cells per n, color coded). Each cell was treated as its own data point, and statistical analysis (unpaired t test) was performed with n = 30 total for each condition. Mean ± SD. Eos-Rap2a Ctrl versus Eos-Rap2a ΔSOCS cells, P < 0.0001. Eos-Rap2a-WT data points are from Fig. 6 E. (N) Rap2a and CD63 colocalization analysis in Ctrl cells versus cells treated with neddylation/Cul5 inhibitor MLN4924. MDA-MB-231 cells stably expressing GFP-Rap2a were treated with either DMSO (Ctrl) or 300 nM MLN4924 for 24 h. Cells were then fixed and stained for CD63, before colocalization analysis. 3i SlideBook6 software was used to calculate the percentage of total GFP-Rap2a that colocalized with CD63 (see Materials and methods). Three biological replicates were performed, with ∼12 cells imaged for each replicate (color coded for each n). Mean ± SD. n = 33 for Ctrl/DMSO treated cells, n = 38 for MLN4924 treated cells. Unpaired t test. P < 0.0001. Source data are available for this figure: SourceData F8.

