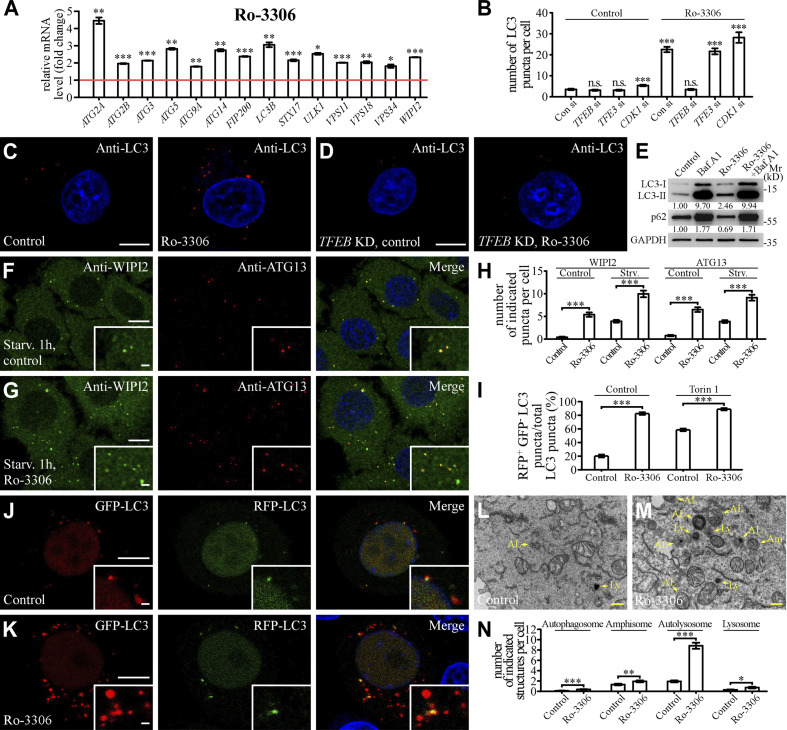
Figure 6.
Ro-3306 promotes autophagy activity. (A) qRT-PCR assays showing upregulation of mRNA levels of autophagic genes in HeLa cells treated with 20 μM Ro-3306 for 24 h. The level of the corresponding mRNA in control cells is set to 1.0. Data (normalized by GAPDH level) are shown as mean ± SEM (n = 3 for each bar). *, P < 0.05; **, P < 0.01; *** P < 0.001. (B–D) The number of LC3 puncta stained by anti-LC3 antibody is increased in HeLa cells treated with 10 μM Ro-3306 (C), and this increase is suppressed by simultaneous depletion of TFEB (D). Quantification of the number of LC3 puncta per cell in control and Ro-3306–treated cells (B). Data are shown as mean ± SEM (n = 30 cells for each bar). ***, P < 0.001. All measured values were statistically compared with the first dataset. (E) Immunoblotting assays to determine the protein levels of LC3 and p62 in control and 10 μM Ro-3306–treated HeLa cells. Quantifications of LC3-II and p62 levels (normalized by GAPDH level) are shown. (F–H) Compared with control cells (F), the number of endogenous WIPI2 and ATG13 puncta stained by anti-WIPI2 and anti-ATG13 antibodies is higher in 10 μM Ro-3306–treated HeLa cells (G) after 1-h starvation. Quantification of the number of WIPI2 and ATG13 puncta per cell in control and Ro-3306–treated cells (H). Data are shown as mean ± SEM (n = 30 cells for each bar). ***, P < 0.001. (I–K) The RFP-GFP-LC3 assay in control and 10 μM Ro-3306–treated HeLa cells. Compared with control cells (J), more red-only puncta are formed in Ro-3306–treated cells (K) under normal conditions. Quantification of the percentage of RFP+GFP– LC3 puncta among total LC3 puncta in control and Ro-3306–treated cells (I). Data are shown as mean ± SEM (n = 30, 29, 30, and 30 cells for control and Ro-3306 treatment under normal and Torin 1–treated conditions, respectively). ***, P < 0.001. (L–N) TEM images showing that the number of autophagic structures (autophagosomes and amphisomes) and lysosomal structures (autolysosomes and lysosomes) is increased in 10 μM Ro-3306–treated HeLa cells (M) compared with control cells (L). Quantifications of the number of autophagosomes, amphisomes, autolysosomes, and lysosomes in control and Ro-3306–treated cells are shown in N. Data are shown as mean ± SEM in N. (n = 94 cells for each bar). *, P < 0.05; **, P < 0.01; ***, P < 0.001. AL, autolysosome; Am, amphisome; Av, autophagosome; Ly, lysosome. Scale bars: 10 μm (C, D, F, G, J, and K); 1 μm (insets in F, G, J, and K); 500 nm (L and M). Source data are available for this figure: SourceDataF6.

