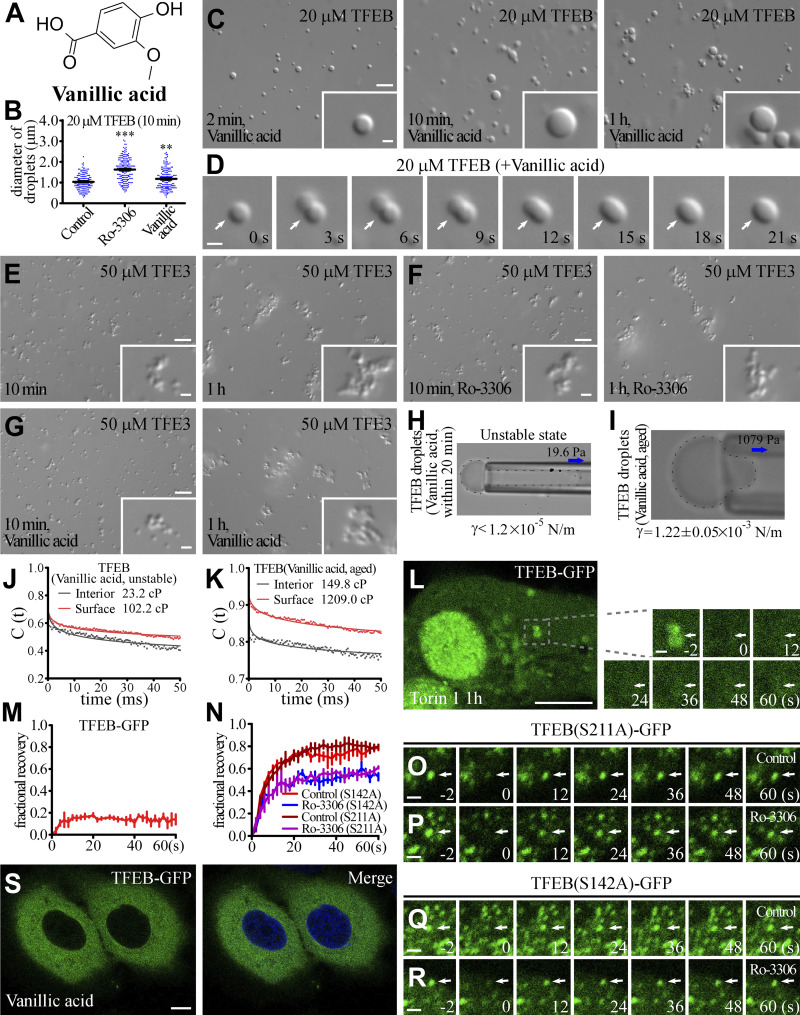
Figure S2.
Small molecules alter the material properties of TFEB droplets. (A) Two-dimensional structure of Vanillic acid. (B) Column scatter charts of the diameters of TFEB droplets formed at 10 min after induction in the absence and presence of 50 μM Ro-3306 or Vanillic acid. Data are shown as mean ± SEM of droplets combined from three fields (89.53 μm × 67.08 μm) for each reaction (n = 150, 184, and 165 for TFEB droplets in the control, Ro-3306 and Vanillic acid systems, respectively). **, P < 0.01; ***, P < 0.001. (C and D) DIC images showing that 20 μM TFEB forms droplets from 2 min to 1 h after LLPS induction in 500 mM NaCl buffer supplemented with 50 μM Vanillic acid (C). D shows time-lapse images of two encountering TFEB droplets undergoing fusion (arrows) with time. The time point of the first image is defined as "0 s." (E–G) DIC images showing that 50 μM TFE3 forms droplets from 2 min to 1 h after LLPS induction in 500 mM NaCl buffer in the absence (E) and presence of 100 μM Ro-3306 (F) and Vanillic acid (G). Addition of Ro-3306 and Vanillic acid has no effect on the size and fusion propensity of TFE3 droplets. (H and I) Representative pictures of the micropipette experiments for newly formed (H) and aged (I) TFEB droplets in 500 mM NaCl buffer supplemented with 100 μM Vanillic acid. 19.6 and 1,079 Pa of negative pressure was used to draw out the surface of newly formed and aged TFEB droplets, respectively. The interfacial tension for newly formed droplets is estimated and shown underneath, and the calculated interfacial tension for aged droplets is shown underneath as mean ± SEM (n = 6). The droplet shown in H was not still, and kept moving into the micropipette; it was completely drawn into the micropipette within seconds. (J and K) Autocorrelation decay curves (solid lines) reflect the rotational behavior of AuNRs in droplets. The calculated apparent viscosity, which is corrected with the viscosity of the solution, is shown at the top. Rotational tracks of the AuNRs in the interior and on the surface were obtained from the same droplets for newly formed (J) and aged (K) TFEB droplets in 500 mM NaCl buffer supplemented with 100 μM Vanillic acid. (L and M) FRAP analysis of the TFEB-GFP signal on lysosomes (arrows) in the cytoplasm of Torin 1-treated HeLa cells (L). M shows quantification of the FRAP data for L. Data are shown as mean ± SEM (n = 3) in M. (N–R) FRAP analysis of TFEB(S211A)-GFP (O and P) and TFEB(S142A)-GFP (Q and R) signals in the punctate structures (arrows) in the nucleus of control and Ro-3306-treated HeLa cells. N shows quantification of the FRAP data for O–R. Data are shown as mean ± SEM (n = 3) in N. (S) Treatment with 10 μM Vanillic acid causes no change in the distribution of TFEB-GFP in HeLa cells stably expressing TFEB-GFP. The nuclei of HeLa cells were stained by DAPI (blue channel). Scale bars: L and S, 10 μm; C and E–G, 5 μm; D, O–R, enlarged figures in L, and inserts in C and E–G, 1 μm.

