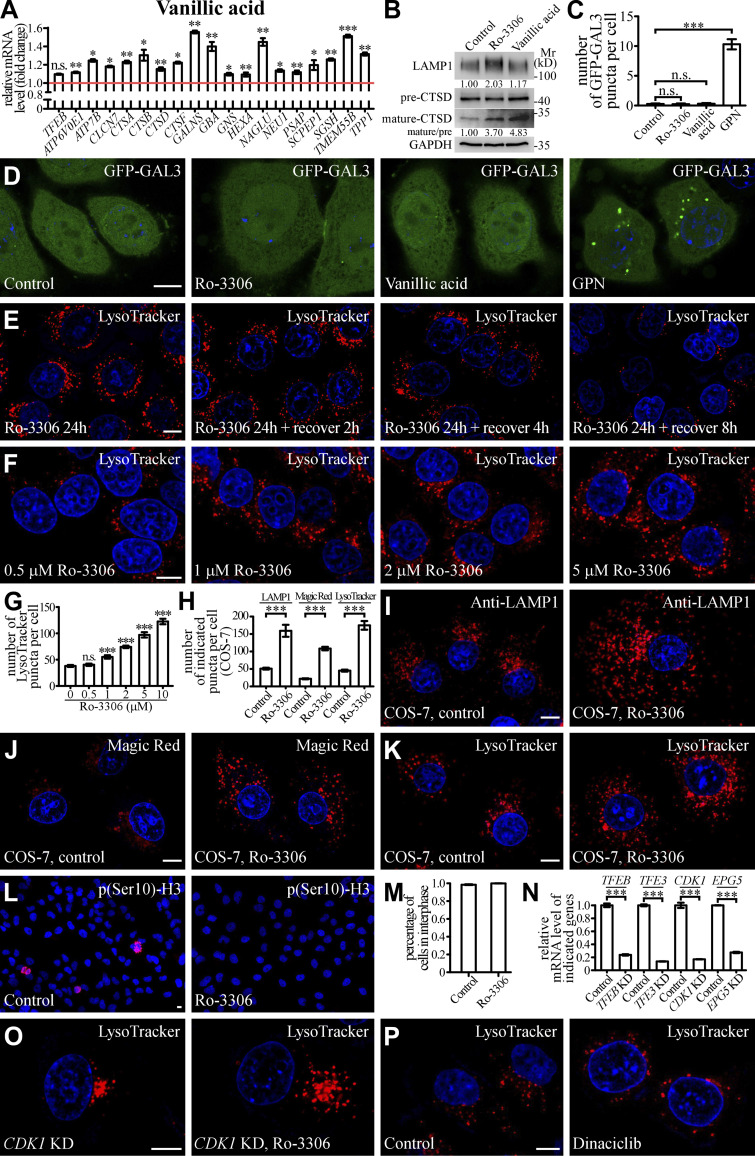
Figure S3.
Small molecules activate lysosomal function and biogenesis. (A) qRT-PCR assays showing upregulation of mRNA levels of lysosomal genes in HeLa cells treated with 10 μM Vanillic acid. The genes are TFEB, ATP6V0E1, ATP7B, CLCN7, CTSA, CTSB, CTSD, CTSF, GALNS, GBA, GNS, HEXA, NAGLU, NUE1, PSAP, SCPEP1, SGSH, TMEM55B, and TPP1. The level of the corresponding mRNA in control cells is set to 1.0. Data (normalized by GAPDH level) are shown as mean ± SEM (n = 3 for each bar). *, P < 0.05; **, P < 0.01; *** P < 0.001. (B) Immunoblotting assays showing protein levels of LAMP1, and precursor and mature forms of CTSD in control and Ro-3306-treated HeLa cells. Quantifications of LAMP1 level (normalized by GAPDH level) and the ratio of mature CTSD/precursor CTSD are shown underneath. (C and D) The number of damaged lysosomes labeled by GFP-GAL3 in control HeLa cells and HeLa cells treated with 10 μM Ro-3306, 10 μM Vanillic acid, or 100 μM GPN (D). GPN treatment results in generation of damaged lysosomes that can be labeled by GFP-GAL3 (Jia et al., 2020), and was used as a positive control. C shows quantification of the number of GFP-GAL3 puncta per cell. Data are shown as mean ± SEM (n = 30 cells for each bar). ***, P < 0.001. (E) After Ro-3306 is washed out, the number of LysoTracker-stained lysosomes in 10 μM Ro-3306-treated HeLa cells gradually decreases to basal level within 8 h. (F and G) Lysosomal biogenesis shown by LysoTracker staining in HeLa cells treated with Ro-3306 at various concentrations (F). G shows quantification of the number of LysoTracker puncta per cell in control cells and cells treated with various concentrations of Ro-3306. Data are shown as mean ± SEM (n = 30 for each bar). ***, P < 0.001. (H–K) Compared to control cells, the number of lysosomal structures labeled by anti-LAMP1 antibody (I), Magic Red (J) and LysoTracker (K) is higher in COS-7 cells treated with 10 μM Ro-3306. Lysosomes become more dispersed in Ro-3306 treated cells. H shows quantification of the number of LAMP1, Magic Red and LysoTracker puncta per cell in control and Ro-3306-treated cells. Data are shown as mean ± SEM (n = 21, 10, 30, 19, 30, and 26 cells for LAMP1 in control and Ro-3306-treated cells, Magic Red in control and Ro-3306-treated cells and LysoTracker in control and Ro-3306-treated cells, respectively). ***, P < 0.001. (L and M) The majority of control and 10 μM Ro-3306-treated HeLa cells are in interphase. Interphase cells are negative for staining with an anti-p(Ser10)-H3 antibody (L). M shows quantification of the percentage of cells in interphase. Data are shown as mean ± SEM (n > 500 cells from at least six independent experiments for each bar). (N) qRT-PCR assays showing that mRNA levels of TFEB, TFE3, CDK1, and EPG5 are effectively depleted by the corresponding siRNAs. The level of the corresponding mRNA in control cells is set to 1.0. Data (normalized by GAPDH mRNA level) are shown as mean ± SEM (n = 3 for each bar). ***, P < 0.001. (O and P) In CDK1 KD HeLa cells, the number of LysoTracker puncta is significantly increased by treatment with 10 μM Ro-3306 (O). Dinaciclib treatment does not change the number of LysoTracker puncta (P). Scale bars: D–F, I–L, O, and P, 10 μm. Source data are available for this figure: SourceDataFS3.

