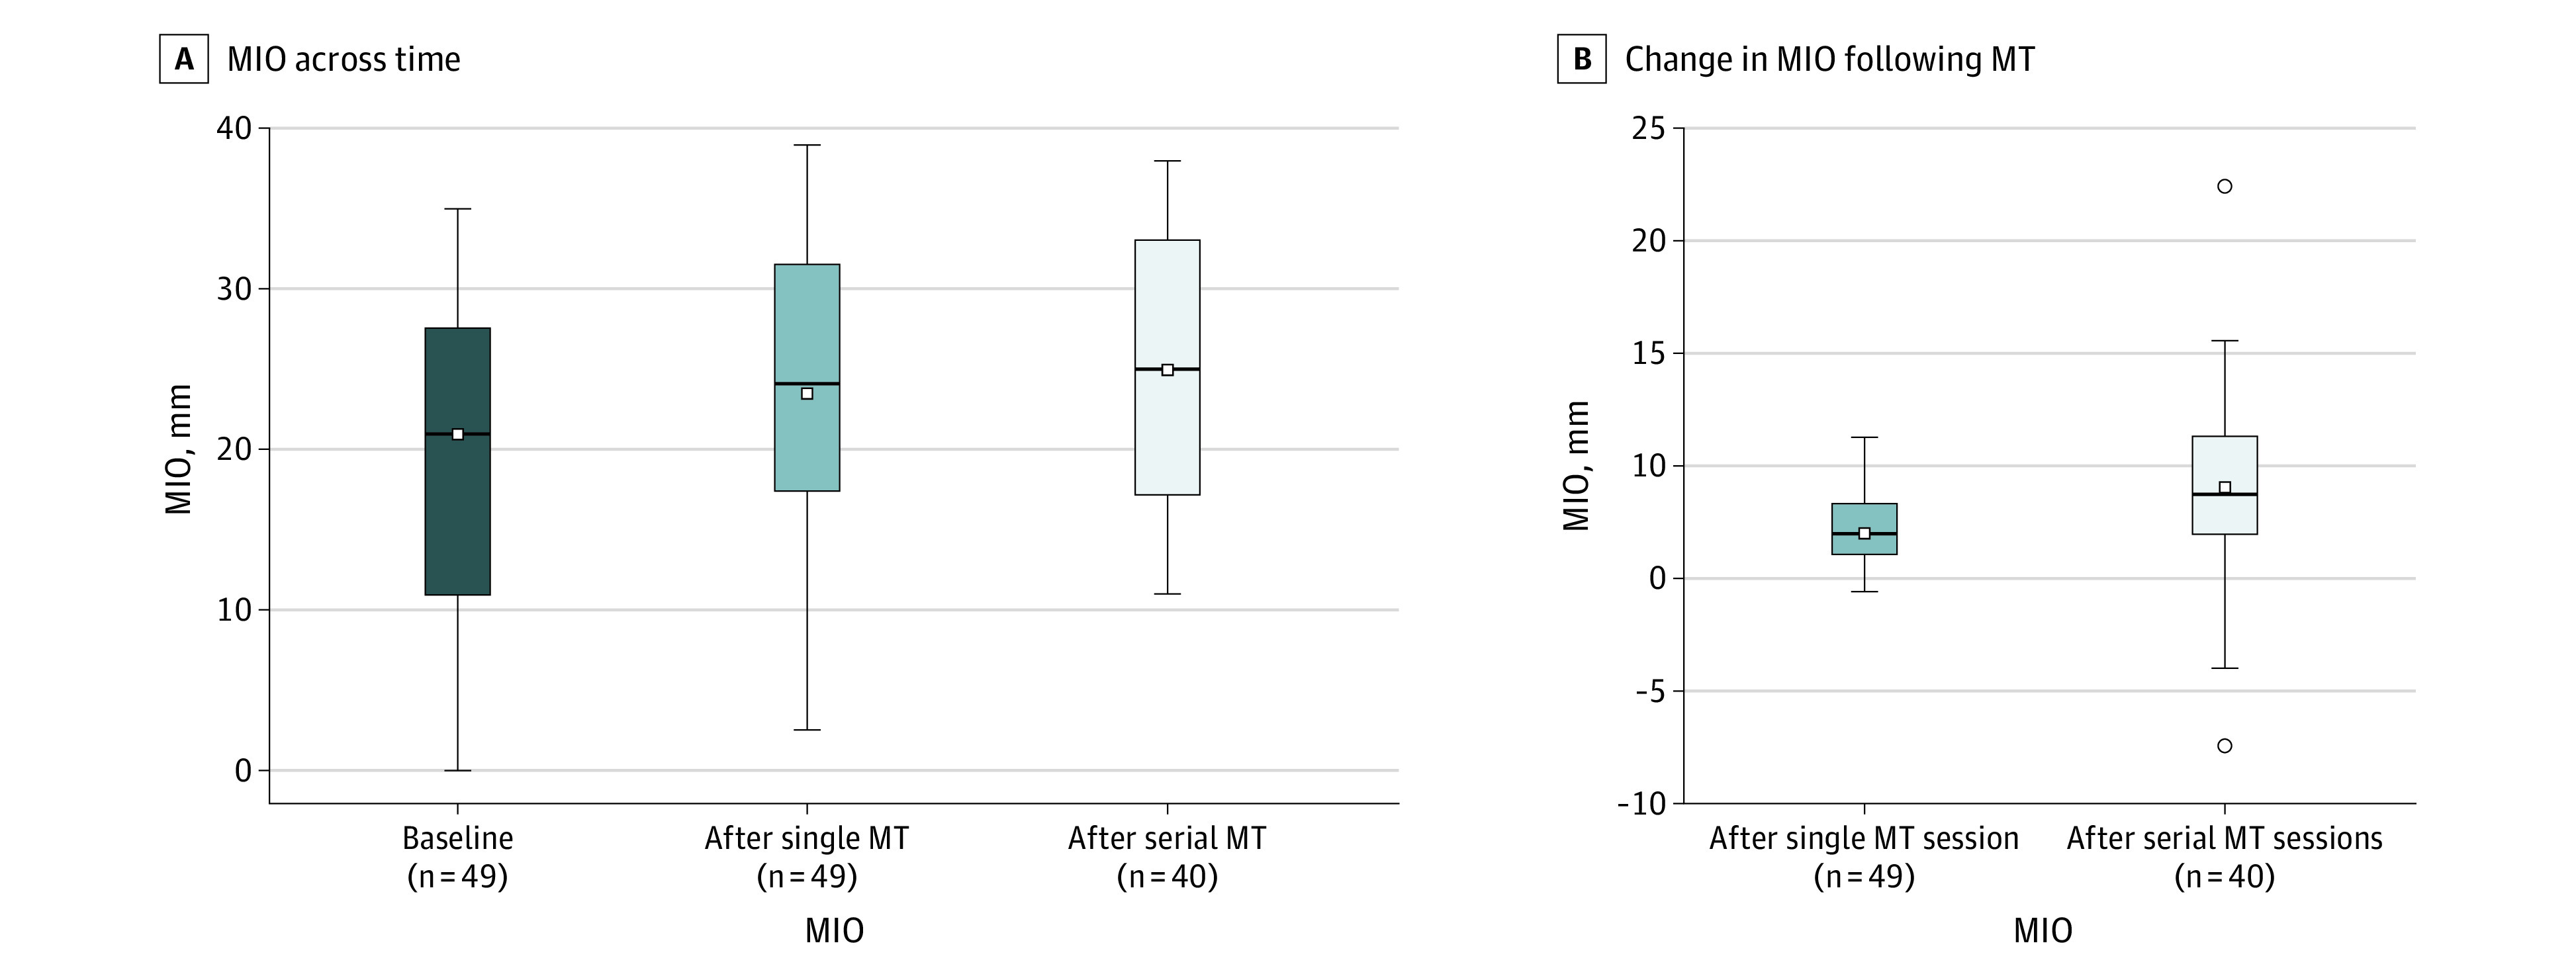
Figure 2. Maximum Interincisal Opening (MIO) Across Time and Changes Following Manual Therapy (MT).

The boxes indicate quartiles; the whiskers, minimum and maximum MIO; the small white squares, mean MIO; the horizontal lines, median MIO; and the small white circles, outliers.
