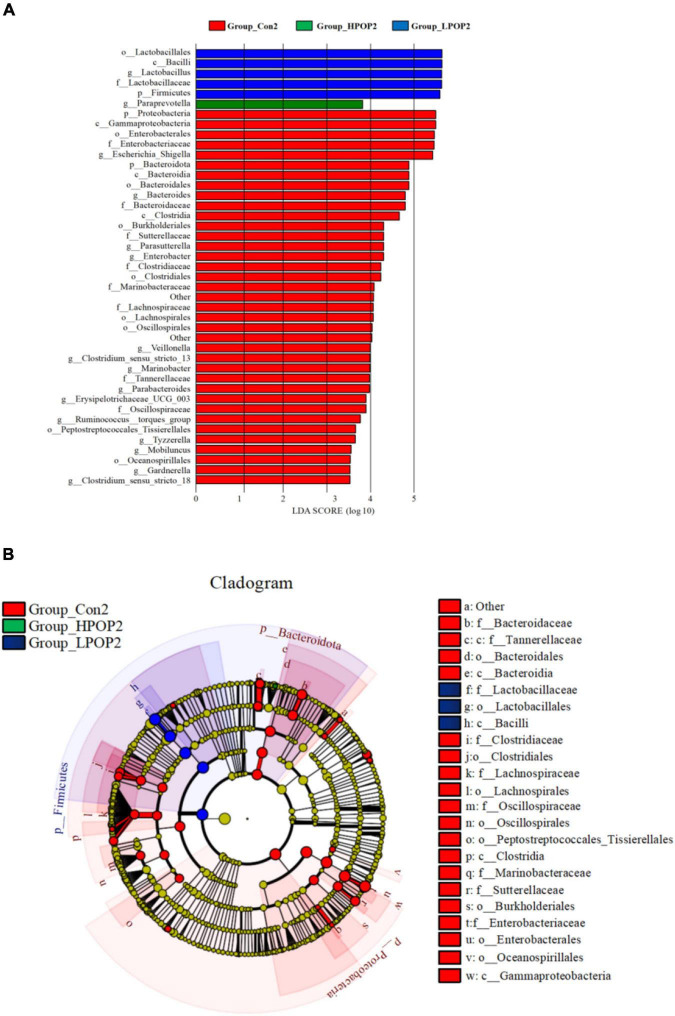
FIGURE 7.
LEfSe analysis showing the most differentially abundant taxa (LDA score >3.0) after 48 h in vitro fecal fermentation with POP. (A) Histogram of the LDA scores. (B) Taxonomic cladogram of all differentially abundant taxa across all taxonomic levels [from the inner to outer rings, phylum (p), class (c), order (o), family (f), and genus (g)].

