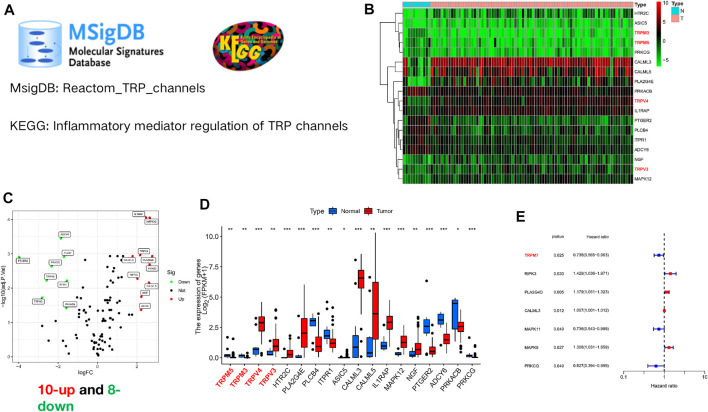
FIGURE 1.
Expression profile of TRP channel-related genes in ESCC. (A) The original gene sets of TRP channels. A gene set (Reactom_TRP_channels) from the MSigDB database, and another gene set (inflammatory mediator regulation of TRP channels) from the KEGG database. (B) Heat map of TRP channel-related genes expression. The genes marked in red are members of the TRP superfamily, including TRPM3, TRPM35, TRPV4, and TRPV3. (C) The volcano plot of TRP channel-related differentially genes expression. Black dot, blue dot and red dot stand for no-statistical significance genes, low-expression genes and high expression genes, respectively. (D) The boxplot displayed the diversity in expression levels of 18 TRP channel-associated DEGs in tumor and normal tissues. (E) The forest plot showed the outcomes of univariate Cox regression analysis of TRP channel-associated genes. *p < 0.05, ***p < 0.001, ****p < 0.0001, ns, not significant.

