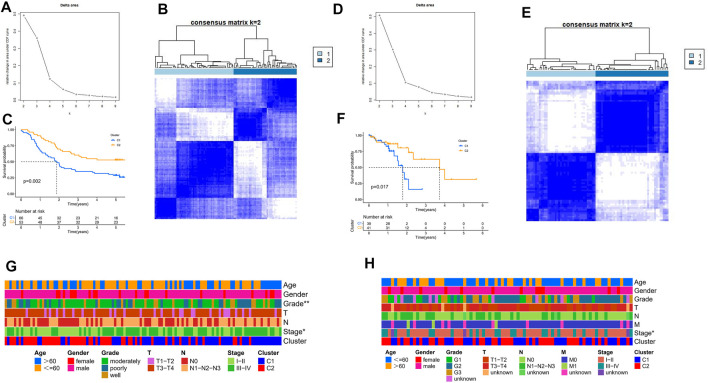
FIGURE 2.
Consensus clustering of TRP channel-related DEGs. (A) Relative variation in region under CDF curve for k = 2 to 9 in the GEO cohort based on different expression genes. (B) The ESCC cohort from GEO was fallen into two different clusters when k = 2. (C) Kaplan-Meier survival analysis in different clusters in the GEO cohort. (D) Relative variation in region under CDF curve for k = 2 to 9 in the TCGA cohort based on different expression genes. (E) The ESCC cohort from TCGA was fallen into two different clusters when k = 2. (F) Kaplan-Meier survival analysis in different clusters in the TCGA cohort. (G) Comparison of the association between the clinicopathological features of two clusters in the GEO cohort. (H) Comparison of the association between the clinicopathological features of two clusters in the TCGA cohort.

