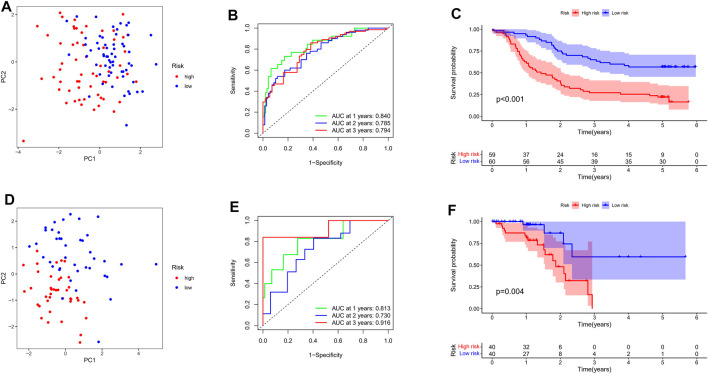
FIGURE 5.
Evaluation the prognostic value of TRP channel-related genes signature. (A) Allocation of patients in the training set on basis of the risk score. (B) AUC of time-dependent ROC curves examined the prognostic performance of the risk score in the training set. (C) Kaplan-Meier curves display the diversity in OS between the high-risk and low-risk groups in the training set. (D) Allocation of patients in the verification set on basis of the risk score. (E) AUC of time-dependent ROC curves examined the prognostic performance of the risk score in the verification set. (F) Kaplan-Meier curves display the diversity in OS between the high-risk and low-risk groups in the verification set.

