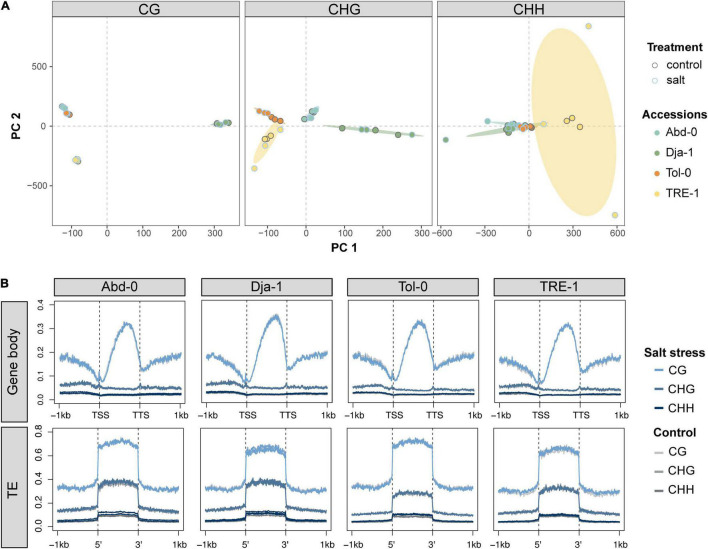
FIGURE 3.
Primary component analysis results of genome-wide single cytosine methylation levels for each sequence context (CG, CHG, and CHH) (A). Different filled colors indicate different accessions, and different edge colors indicate the control and salt stress conditions. (B) The averaged methylation levels over gene regions and transposable elements (TEs) under control and salt stress conditions.

