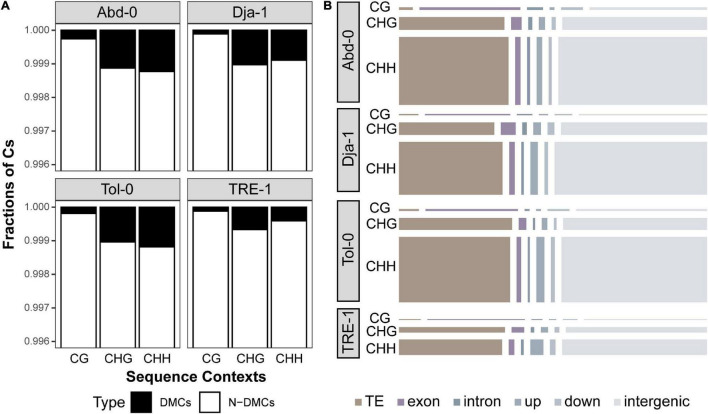
FIGURE 4.
The percentage of differentially methylated cytosines (DMCs) caused by salt stress and non-differentially methylated cytosines (N-DMCs) across the genome for each accession (A). The number of DMCs annotated to different genomic regions, including the TE, exon, intron, upstream and downstream of genes, and intergenic region (B). The areas of the rectangles represent the number of (CG-, CHG-, or CHH-) DMCs annotated to the specific genomic region.

