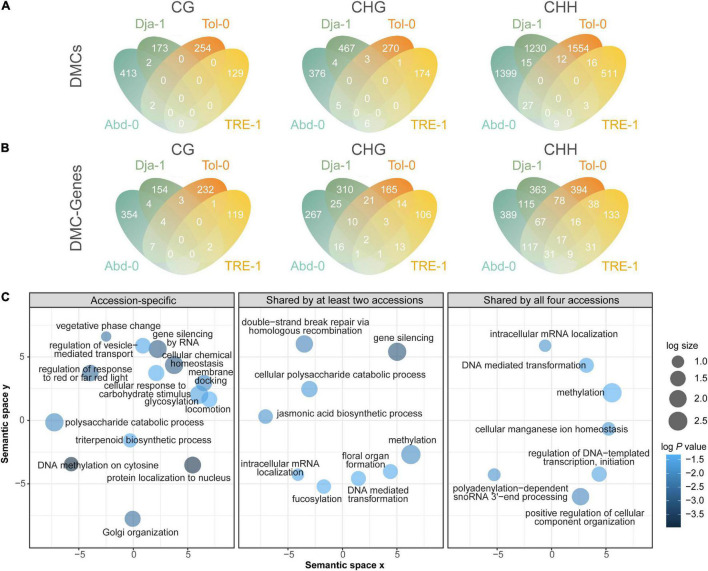
FIGURE 6.
Methylation dynamics on genes and their approximate regulatory regions. Venn diagrams of DMCs on genes and the approximate regulatory regions among accessions (A) and DMC-genes among accessions (B). (C) GO enrichment results of DMC-genes after reducing redundant terms. The GO enrichment analysis was conducted for accession-specific DMC-genes, DMC-genes shared by at least two accessions, and DMC-genes shared by all four analyzed accessions. The sizes of circles indicate the frequency of the significantly enriched GO terms (P values < 0.05) in the GO term database, where bubbles of more general terms are larger. The color of circles indicates the log10 transformed P values.

