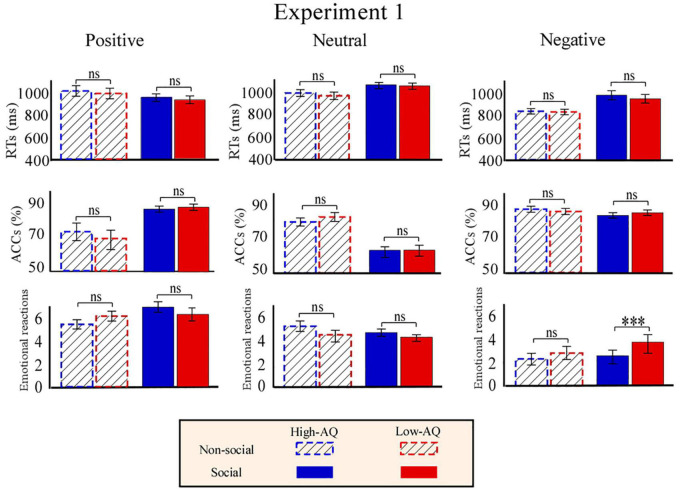
FIGURE 3.
Behavioral results from Experiment 1. Bar charts show responses of High-AQ (blue) and Low-AQ (red) groups to positive (left column), neutral (middle column), and negative (right column) pictures with social (solid bar) or non-social (dotted bar) dimensions. Data of RTs, ACCs, and emotional reactions are shown in the top, middle, and bottom panels. Data in the bar charts are expressed as Mean ± SEM. nsp > 0.05, *p < 0.05, **p < 0.01, ***p < 0.001.

