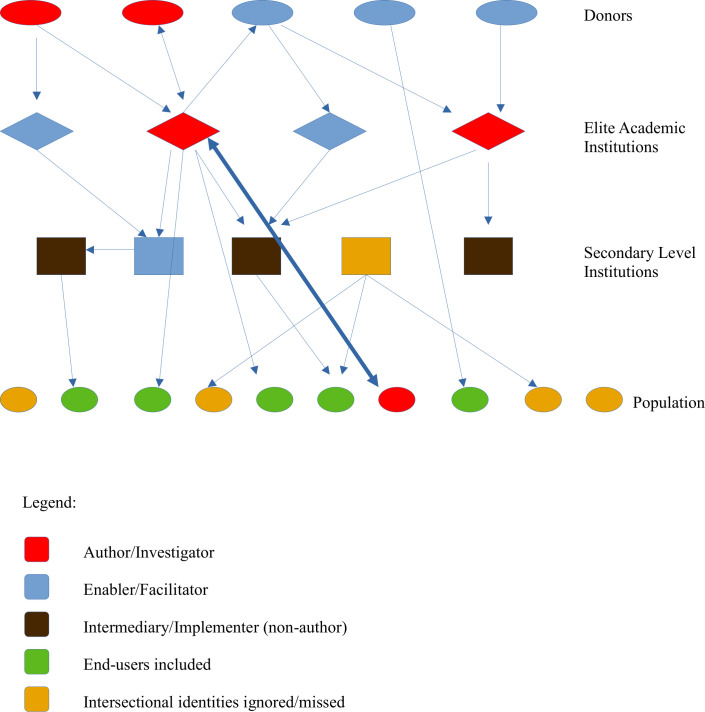
Figure 1.
Directed Graph of Ontology: Shown here is an example of how a directed ontological graph could look like. Ontologies (the nature of entities in a transaction and relationships between them) can be visually examined using a directed graph. Shapes indicate the hierarchical status and colour-coding indicates the level of inclusion/exclusion. Ontologies can make explicit the validity of assumptions about actors and relationships, identify bottlenecks and indicate excluded intersectional identities. This graphic can be modified to elucidate the relationships between epistemological entities (concepts) and how different levels of concepts validate/nullify ensuing entities and which intersectional identities are rendered invalid in a given scheme of reasoning.

