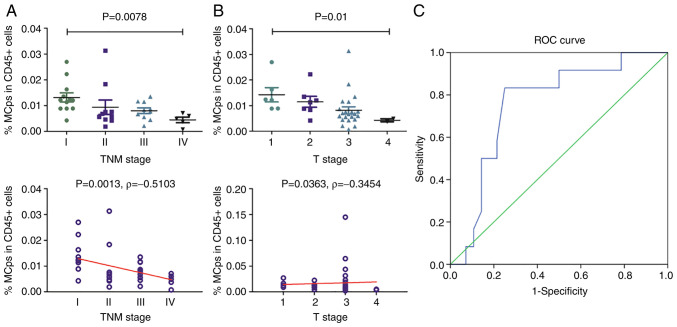
Figure 2.
Correlation analysis between the frequency of MCps and clinical data in 37 CRC patients. Association and correlation between the MCp frequency and (A) TNM and (B) T stage; Spearman's correlation coefficient was used for correlation analysis. (C) ROC curve among MCps and colorectal cancer stage. TNM staging of 37 CRC patients was evaluated, including 12 patients with TNM I and 25 patients with TNM II/III/IV. MCps, mast cell progenitors; ROC, receiver operating characteristic; TNM, Tumour-Node-Metastasis.

