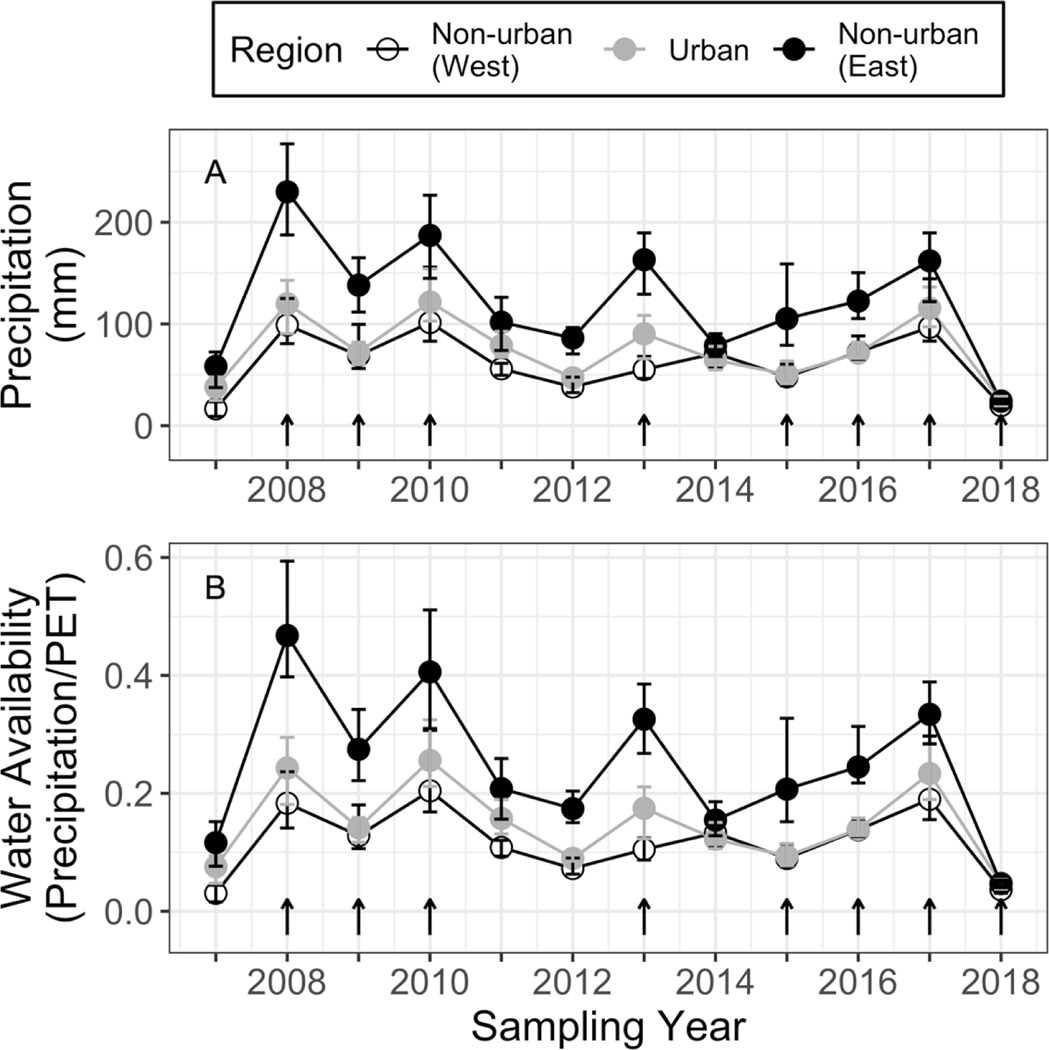
Figure 3.
Precipitation (A) and water availability (B) recorded during the winter annual plant growing season (October - March). Points show the mean value for the five experimental sites within each region, and error bars show the range for a given region and year. Arrows above the x axis indicate years in which the annual plant community was sampled.

