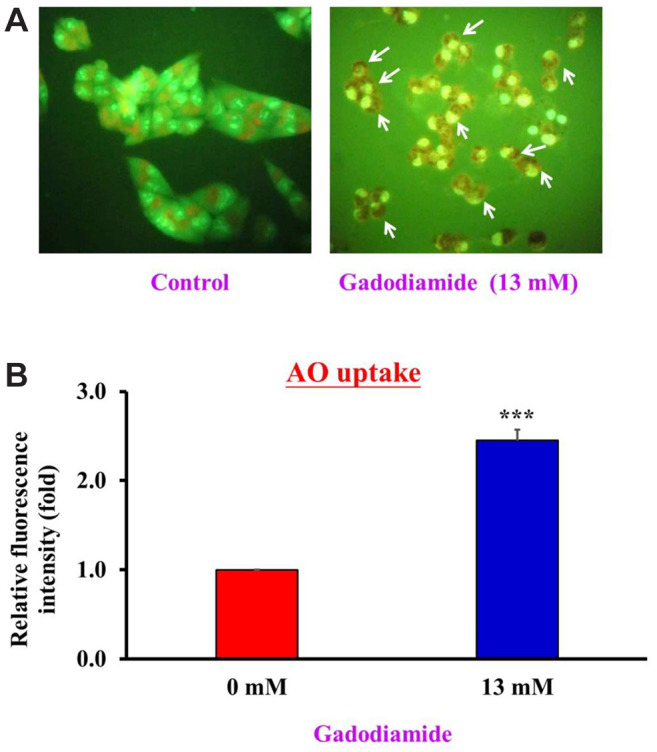
Figure 2. Gadodiamide induced autophagy in HaCaT cells. (A) Fluorescence images of acridine orange (AO)-stained HaCaT cells after treatment with or without 13 mM gadodiamide; left: vehicle-treated control; right: 13 mM gadodiamide-treated cells. (B) Quantitative data for HaCaT cells treated with or without 13 mM gadodiamide treatment. *Statistically significant difference from vehicle-treated control cells.

