. 2022 Mar 3;36(2):582–595. doi: 10.21873/invivo.12741

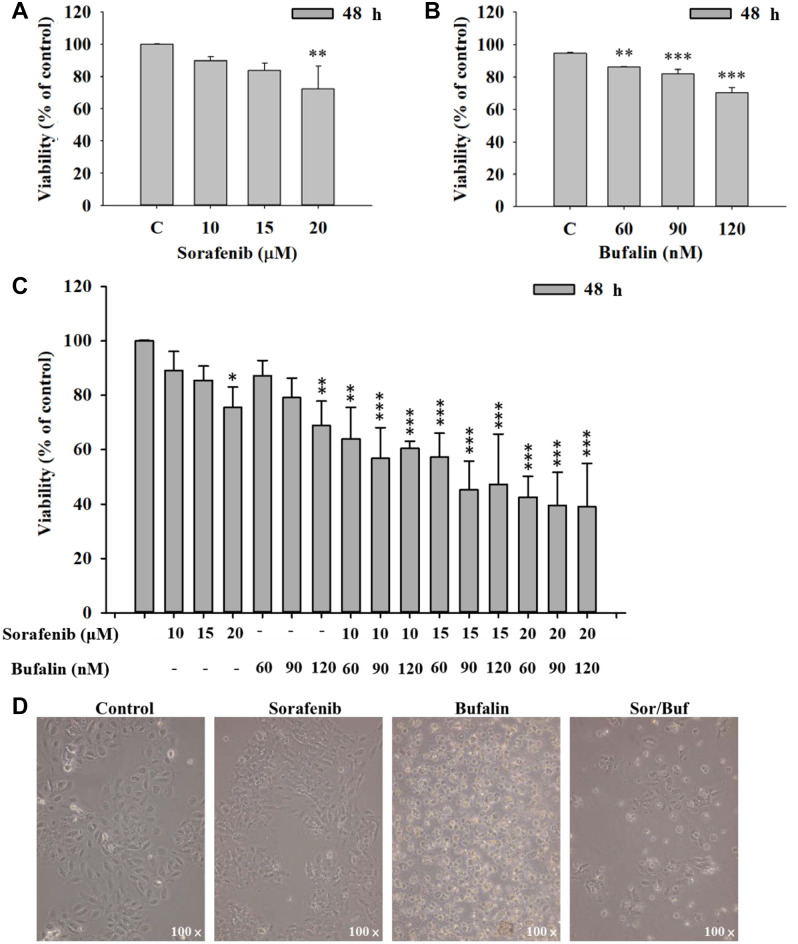
Figure 1. The effects of sorafenib, bufalin, or the combination of sorafenib with bufalin on cell viability and morphology in NCI-H292 cells. Cells (1×10⁵ cells/well) were treated with sorafenib (0, 10, 15, and 20 μM) (A), or bufalin (0, 60, 90, and 120 nM) (B) for 48 h, cells were harvested and the cell viability was measured by flow cytometry. Cells were treated with the combination of sorafenib (10-20 μM) and bufalin (60-120 nM) for 48 h, and total cell viability was measured (C). The cell morphology after cells were treated with 15 μM sorafenib, 90 nM bufalin, and the combination of 15 μM sorafenib and 90 nM bufalin, was observed and photographed using contrast-phase microscopy. Results aere displayed as mean±SD. *p<0.05, **p<0.01, or ***p<0.001, significant difference when compared to controls.

Figure 1