. 2022 Mar 3;36(2):582–595. doi: 10.21873/invivo.12741

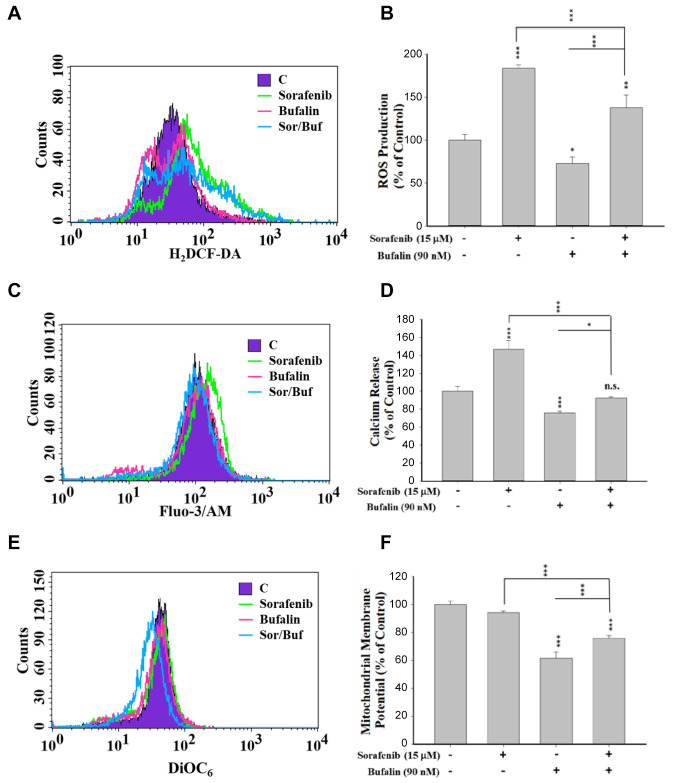
Figure 4. The effects of sorafenib, bufalin, or the combination of sorafenib with bufalin on the production of reactive oxygen species (ROS) and Ca2+ and the levels of mitochondrial membrane potential (ΔΨm) in NCI-H292 cells. Cells (1×10⁵ cells/well) were treated 15 μM sorafenib, 90 nM bufalin, or the combination of 15 μM sorafenib with 90 nM bufalin for 48 h. Then cells were collected and resuspended in DCFH-DA solution for measuring the changes of ROS (H2O2) (A and B), in Fluo-3/AM solution for measuring intracellular Ca2+ level (C and D), and in DiOC6 reagent for measuring ΔΨm levels (E and F) by flow cytometry. Data represent mean±SD. *p<0.05, **p<0.01, or ***p<0.001, a significant difference when compared to sorafenib- or bufalin-treated alone. n.s., No significant difference when compared to sorafenib- or bufalin-treated alone (p>0.05).

Figure 4