Figure 3.
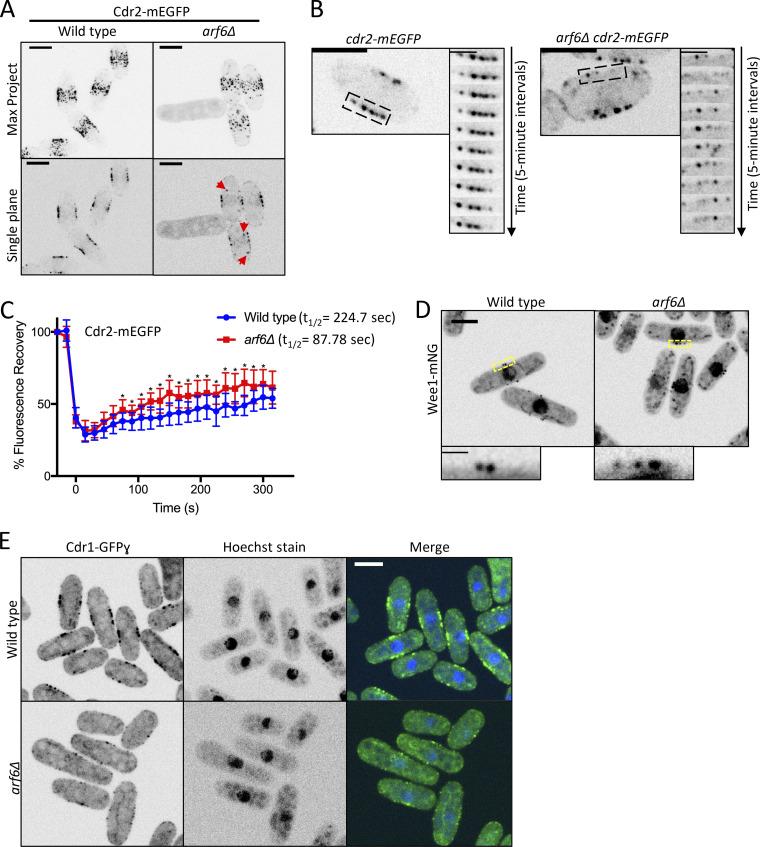
Cdr2 nodes are disrupted in arf6Δ. (A) Maximum-intensity projections (Max Project) of z series (top) or single middle focal planes (bottom). Red arrows indicate cytoplasmic Cdr2 puncta. (B) Time-lapse imaging of Cdr2-mEGFP from middle focal plane. Montages show 5-min time points from boxed regions. (C) FRAP analysis of Cdr2-mEGFP in wild-type and arf6Δ cells. n = 10 cells each. Points are mean ± SD; *, P ≤ 0.05 by Welch’s unpaired t test. (D) Middle focal plane images of Wee1-mNG. Insets are zooms of yellow boxes. (E) Middle focal plane images. Scale bars for A, B, D, and E are 5 µm; for B inset, 2 µm; and for D inset, 1 µm.

