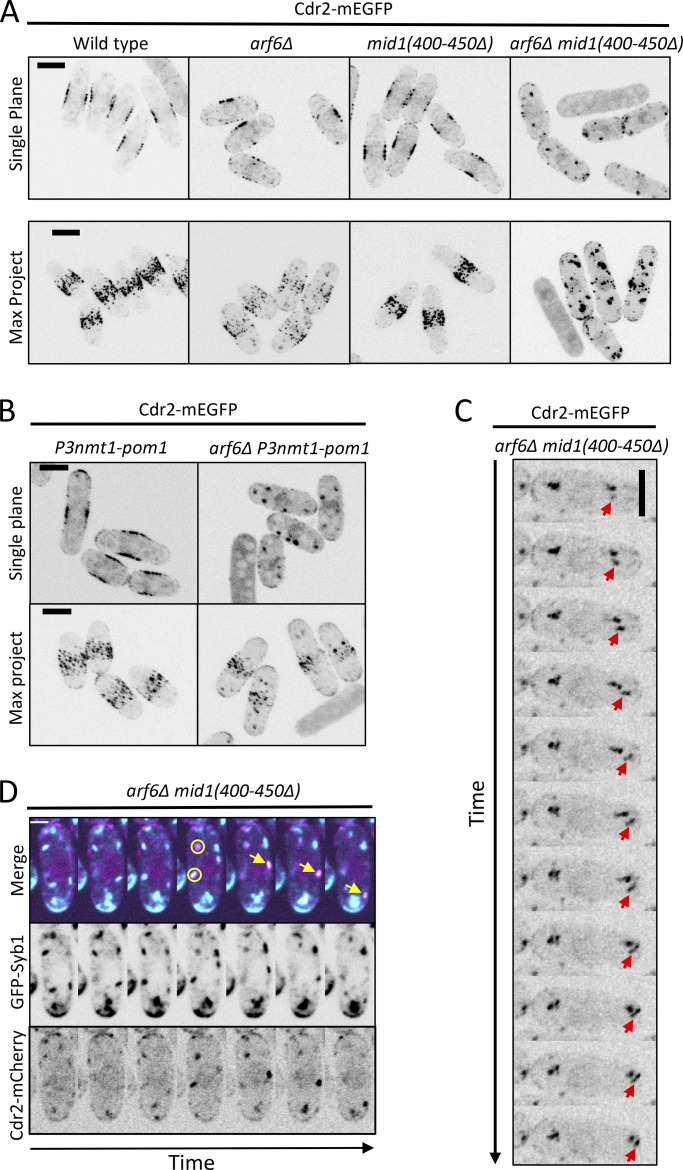
Figure 4.
Cdr2 node mutants exacerbate arf6Δ phenotypes. (A and B) Cdr2-mEGFP localization in the indicated strains. Single focal planes and maximum-intensity projection (Max Project) images of z series. (C) Montage of no-delay time lapse for single focal plane. Arrow follows a moving Cdr2 punctum. (D) Mobile Cdr2 puncta colocalize with exocytic vesicle marker Syb1. Circles mark colocalizing puncta, and arrows mark moving colocalized punctum. Cells were imaged every 30 s. Scale bar in D is 2 µm; all other scale bars are 5 µm.

