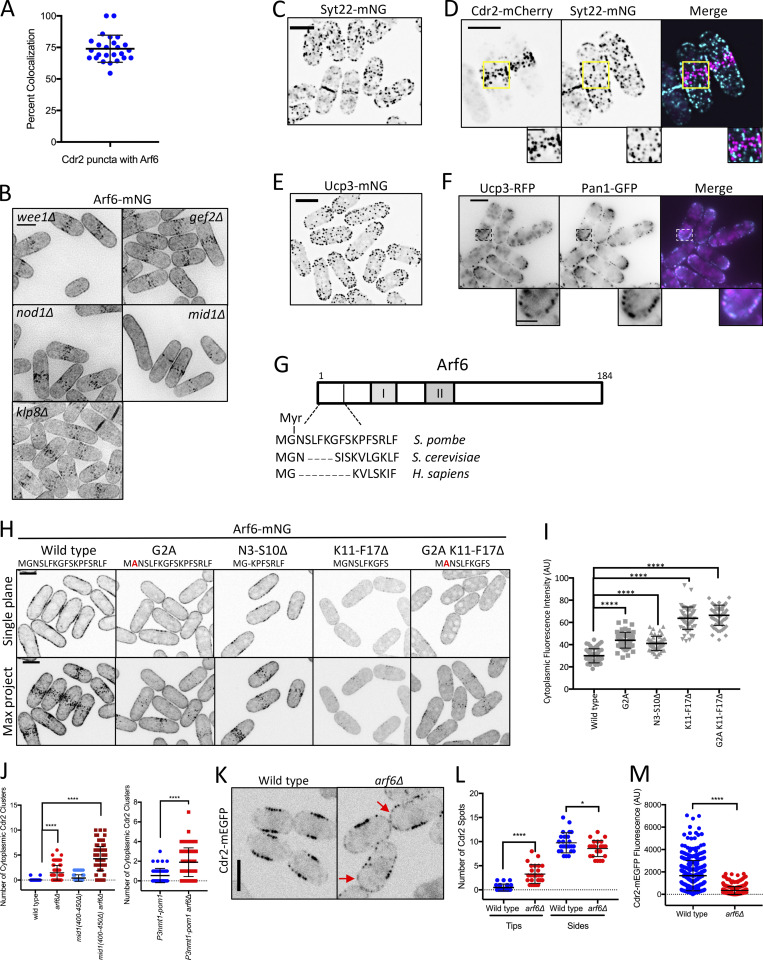
Figure S2.
Localization, regulation, and function of Arf6 at cortical nodes. (A) Arf6 is a component of most Cdr2 nodes. Each point indicates the percentage of Cdr2 nodes with Arf6 present from a single cell. Bars represent mean ± SD; n = 25 cells. (B) Localization of Arf6 in the indicated mutants. Images are sum intensity projections of deconvolved z series. (C) Maximum-intensity projection of a deconvolved z series. (D) Maximum-intensity projection of a deconvolved z series. Insets show zooms of boxed areas. (E) Maximum-intensity projection of a deconvolved z series. (F) Middle single focal plane images. Insets show zooms of boxed areas. (G) Schematic showing relative conservation of the Arf6 Nter from fission yeast, budding yeast, and humans. (H) Single middle focal plane and maximum-intensity projections (Max Project) from z series. (I) Cytoplasmic fluorescence intensity of the indicated strains. n > 50 cells each. Graphs show mean ± SD. Statistical analysis was evaluated by one-way ANOVA with Tukey’s multiple comparison. (J) Cdr2 cytoplasmic puncta counted from five middle focal planes. n > 50 cells each. Statistical analysis was evaluated by one-way ANOVA with Tukey’s multiple comparison (left) or Welch’s unpaired t test (right). (K) Single focal plane images. Red arrows point to Cdr2 at cell tips. (L) Quantification of Cdr2 nodes/spots at cell sides and cell tips. Note the increase in Cdr2 spots at cell tips in arf6Δ cells. Statistical analysis was evaluated by Welch’s unpaired t test, n = 25 cells. (M) Quantification of Cdr2-mEGFP signal per node from the indicated strains. Each point represents a single node. Statistical analysis was evaluated by Welch’s unpaired t test. n = 25 cells. Bars represent mean ± SD; ****, P ≤ 0.0001; *, P ≤ 0.05. Scale bars of insets are 2 µm; all other scale bars are 5 µm.

