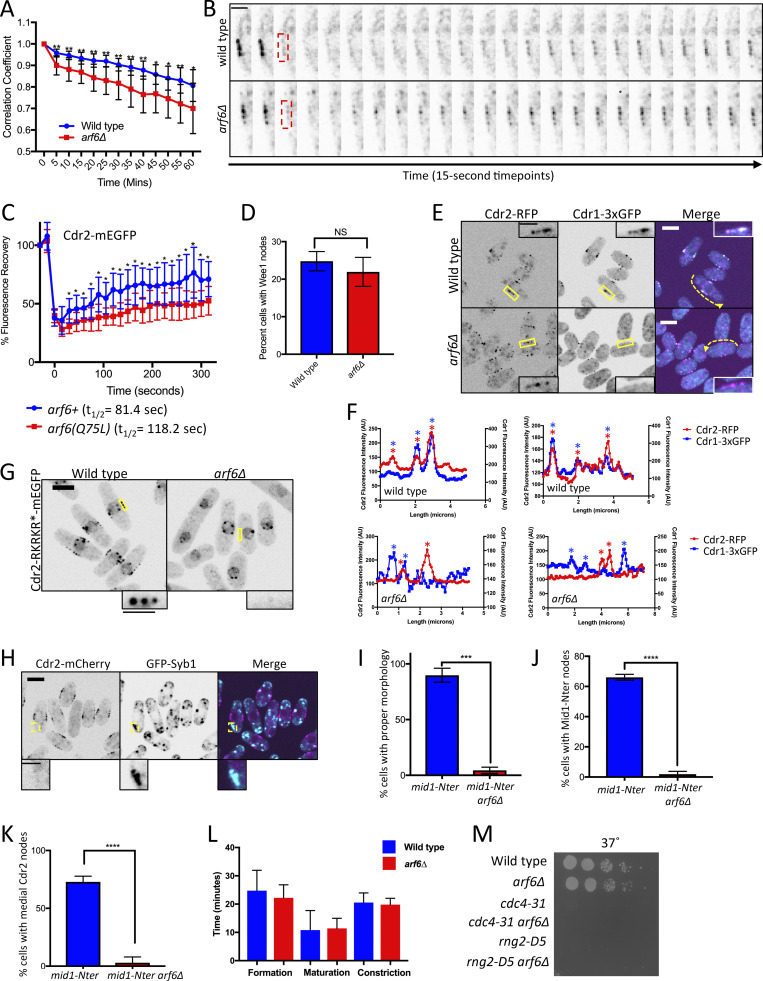
Figure S3.
Node defects in arf6∆ cells. (A) Quantification of Cdr2-mEGFP dynamics from time-lapse imaging. For single cells, the Pearson correlation coefficient was measured for each time point compared with the initial image (time = 0); n = 10 cells for each strain. A faster rate of decay for the correlation coefficient indicates loss of stability for Cdr2-mEGFP localization. **, P ≤ 0.01; *, P ≤ 0.05 by Welch’s unpaired t test performed for each time point. (B) Examples of FRAP experiment where red boxed region was photobleached and analyzed for recovery. Scale bar is 2 µm. (C) FRAP analysis of Cdr2-mEGFP at nodes in the indicated strains. n = 10 cells each. Points are mean ± SD; *, P ≤ 0.05 by Welch’s unpaired t test performed for each time point. (D) Percentage of cells with Wee1 localization at cortical nodes for wild-type versus arf6Δ strains. Bars indicate mean ± SD; n = 100 cells each. NS, not significant by Welch’s unpaired t test. (E) Middle focal plane images. Insets are zooms of yellow boxes. (F) Fluorescence intensity of line scans along cortex of cells as in E (dashed yellow lines). Asterisks mark node peaks for Cdr2 (red) and Cdr1 (blue). Note overlapping peaks in wild-type but not in arf6Δ cells (two cells each). (G) Middle focal plane images. (H) Middle focal plane images; insets are zooms of yellow boxes. (I–K) Quantification of cell morphology (I), Mid1-Nter localization (J), and Cdr2 localization (K) for the indicated strains. Bars represent mean ± SD from biological triplicate experiments with n > 50 cells each. ****, P ≤ 0.0001 and ***, P ≤ 0.001 by Welch's unpaired t test. (L) Timing of cytokinesis measured with Sad1 and Rlc1. n = 20 cells each, bars represent mean ± SD. (M) Serial dilution growth assay at 37°C (from Fig. 5 C). Main panel scale bars are 5 µm; inset scale bars are 2 µm.

