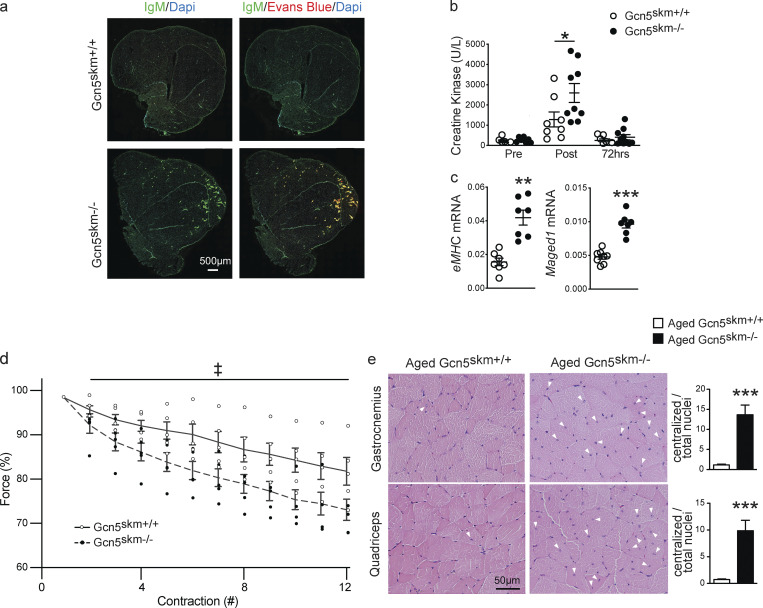
Figure 3.
GCN5 maintains muscle force and protects from damage following eccentric contractions and with aging. (a) Representative images of immunofluorescent staining of right quadriceps muscles from 6-mo-old control and Gcn5skm−/− mice sacrificed 24 h after downhill running using anti-IgM cross-adsorbed secondary antibody alone (left column) or in combination with EBD fluorescence (right column). Images were tile scanned and stitched. All animals completed the nonexhaustive downhill running protocol. n = 3/group. Scale bar, 500 μm. (b) Plasma creatine kinase levels in 6-mo-old control and Gcn5skm−/− mice measured before (Pre), directly after (Post), and 72 h after (72 h) downhill running. Data are presented as mean ± SEM for controls and Gcn5skm−/− mice. n = 7–9/group. *, P < 0.05 by ANOVA with Tukey’s post hoc test versus Gcn5skm+/+. (c) Relative expression of embryonic myosin heavy chain (eMHC) and Maged1 in 6-mo-old control and Gcn5skm−/− gastrocnemius tissues harvested 72 h after downhill running. Data are presented relative to housekeeping genes 36b4 and Gapdh and as mean ± SEM for controls and Gcn5skm−/− mice. n = 7/group. **, P < 0.01; ***, P < 0.001 versus Gcn5skm+/+ as measured by two-tailed Student’s t test. (d) Force measurement (percentage of initial contraction) of consecutive eccentric contractions of diaphragm strips harvested from 6-mo-old control and Gcn5skm−/− mice. Data are presented as mean ± SEM for controls and Gcn5skm−/− mice. n = 5/group. ‡, main effect of P < 0.0001 by two-way ANOVA for genotype. (e) Representative sections of gastrocnemius and quadriceps muscles from 12-mo-old control and Gcn5skm−/− mice stained with hematoxylin and eosin (brightfield) with examples of centralized nuclei identified with arrowheads. The number of centralized nuclei per total nuclei in control Gcn5skm−/− mice was quantified using three images per section. Data are presented as mean ± SEM for controls and Gcn5skm−/− mice. n = 3/group. ***, P < 0.001 versus Gcn5skm+/+ as measured by two-tailed Student’s t test. Scale bars, 50 μm.

