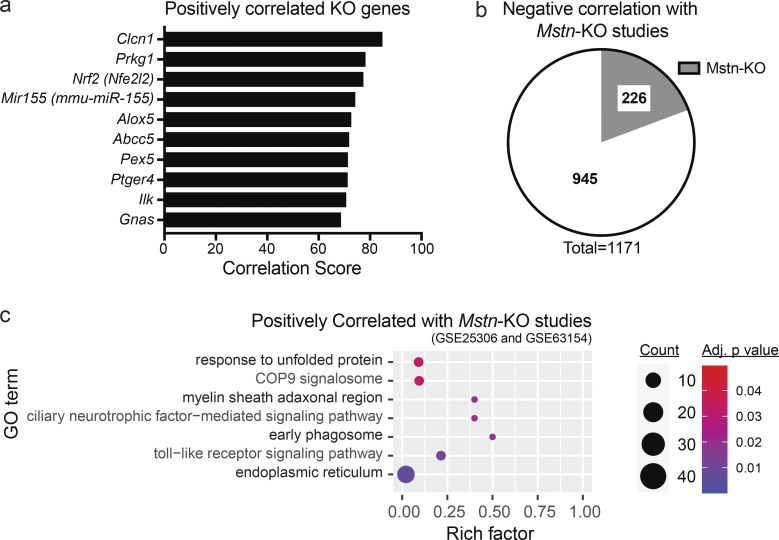
Figure S3.
Bioinformatic analysis of the Gcn5skm−/− bioset. (a) Bar graph showing positively correlated KO genes obtained from BSCE by using all differentially expressed genes from the Gcn5skm−/− bioset as an input. (b) Pie chart representing negatively correlated genes between Gcn5skm−/− and Mstn-KO (Gene Expression Omnibus accession nos. GSE25306 and GSE63154) biosets following meta-analysis of the selected studies for down-regulated and up-regulated genes. (c) Bubble plot showing the distribution and size of positively correlated overrepresented GO pathways between the Gcn5skm−/− differentially expressed bioset and Mstn-KO study biosets (Gene Expression Omnibus accession nos. GSE25306 and GSE63154).

